


Original Research
Tele-Law: Bridging the Legal Access Gap for Marginalized Communities in Rural India Using ICT
- Abstract
- Full text
- Metrics
The Tele-Law scheme in India leverages Information and Communication Technology (ICT) to provide legal assistance to marginalized communities through Community Service Centers (CSCs). This paper evaluates the Tele-Law scheme's current implementation process and impact, focusing on how ICT has enhanced access to justice, particularly in rural and marginalized communities. We describe the implementation of the Tele-Law scheme in India, followed by an analysis of available data on the scheme focusing on metrics related to access to justice, types of cases filed by the vulnerable sections, and the resolution of these cases. The study uses a combination of quantitative and qualitative data to assess the impact of ICT on the judicial system's effectiveness and the impact of CSCs. Our findings highlight significant improvements in legal access for rural populations. The study identified a few challenges in the Tele-Law implementation scheme, such as digital literacy, infrastructure gaps, and systemic barriers. We recommend reengineering the current implementation process and suggest strategies to improve the scheme's reach and efficiency by adding additional tools to integrate ICT into the Tele-Law program. This will enhance the reach of Tele-Law, improve service quality, and ensure a sustainable long-term impact on the legal empowerment of marginalized populations in India.
Tele-Law: Bridging the Legal Access Gap for Marginalized Communities in Rural India Using ICT
Venkatapparao Mummalaneni, Chandrashekar Challa
Department of Management & Marketing, Virginia State University, USA
Computer Information Systems, Virginia State University, USA
Abstract:
The Tele-Law scheme in India leverages Information and Communication Technology (ICT) to provide legal assistance to marginalized communities through Community Service Centers (CSCs). This paper evaluates the Tele-Law scheme's current implementation process and impact, focusing on how ICT has enhanced access to justice, particularly in rural and marginalized communities. We describe the implementation of the Tele-Law scheme in India, followed by an analysis of available data on the scheme focusing on metrics related to access to justice, types of cases filed by the vulnerable sections, and the resolution of these cases. The study uses a combination of quantitative and qualitative data to assess the impact of ICT on the judicial system's effectiveness and the impact of CSCs. Our findings highlight significant improvements in legal access for rural populations. The study identified a few challenges in the Tele-Law implementation scheme, such as digital literacy, infrastructure gaps, and systemic barriers. We recommend reengineering the current implementation process and suggest strategies to improve the scheme's reach and efficiency by adding additional tools to integrate ICT into the Tele-Law program. This will enhance the reach of Tele-Law, improve service quality, and ensure a sustainable long-term impact on the legal empowerment of marginalized populations in India.
KEYWORDS: Information & Communication Technology (ICT), Tele-Law, Legal Assistance, Community Service Centers (CSCs)
Access to justice is a fundamental human right, yet millions of people worldwide, particularly in marginalized communities, face significant barriers to accessing legal services. In India, the Tele-Law scheme aims to bridge this gap by leveraging ICT to provide legal assistance to underserved populations. The scheme facilitates remote consultations with legal professionals by establishing CSCs equipped with video conferencing facilities, thereby reducing the need for physical travel and associated costs. This paper evaluates the implementation process and impact of the Tele-Law scheme, focusing on its effectiveness in enhancing access to justice for marginalized communities. The plan for the rest of the paper is to provide a brief review of the literature on ICT in the legal system worldwide, describe the implementation of the Tele-Law scheme in India, followed by an analysis of available data on the scheme focusing on metrics related to access to justice, types of cases filed by the vulnerable sections and the resolution of these cases. We discuss the results, draw conclusions regarding the impact of ICT on the judicial system, and make recommendations for future research in this area.
Literature Review
Global Trends in ICT and Legal Services
The integration of ICT in legal services has gained momentum globally, with various countries adopting digital solutions to improve access to justice. Studies by the United Nations Office on Drugs and Crime (UNODC, 2022) and the Organization for Economic Co-operation and Development (OECD, 2023) highlight the potential of digital technologies to streamline legal processes, reduce costs, and enhance transparency.
The adoption of ICT in the legal sector aligns with broader global trends towards digital transformation in public services. The World Bank's report on digital government underscores the role of ICT in enhancing government service delivery, stating that "digital tools can significantly improve efficiency, transparency, and inclusiveness" (World Bank, 2021). These principles directly apply to the legal sector, where ICT is used to streamline processes, enhance accessibility, and reduce barriers to justice.
Case Studies from Developed Nations
In developed nations, ICT initiatives such as online dispute resolution platforms, virtual courtrooms, and legal aid websites have significantly improved access to justice. These case studies provide valuable insights into the benefits and challenges of implementing similar solutions in developing countries.
United States
In the United States, the use of technology in the legal system has been extensive. The Legal Services Corporation (LSC) has implemented various digital initiatives, including online portals for legal advice and document automation (Legal Services Corporation, 2020, January). According to the LSC, "technology deployment has made legal services more accessible, particularly for low-income individuals who face significant barriers to accessing traditional legal services" (Legal Services Corporation, 2020, January). The integration of chatbots, AI-driven legal advice platforms, and online dispute resolution (ODR) systems has enhanced the efficiency and accessibility of legal services.
United Kingdom
The UK has pioneered the use of technology in its court systems. The HM Courts & Tribunals Service has implemented digital case management systems and online courts, significantly reducing delays and improving case management. A UK Ministry of Justice report highlights that "the introduction of online platforms for civil claims and tribunals has reduced the average time for case resolution by 40%" (Ministry of Justice, United Kingdom, 2021). Additionally, the UK's development of the 'Her Majesty's Courts and Tribunals Service' (HMCTS) digital strategy emphasizes the importance of user-centered design, aiming to make the justice system more accessible and efficient.
Australia
Australia has also made significant strides in integrating technology into its legal system. The Australian courts have adopted electronic filing systems and video conferencing. The Australian Law Reform Commission (ALRC) notes that "the use of electronic filing and video conferencing has improved access to justice, particularly for people in remote areas" (Australian Law Reform Commission, 2020). The Australian government's investment in digital justice initiatives aims to enhance the efficiency and inclusivity of the legal process.
Innovations in Developing Countries
Kenya
In Kenya, the Judiciary's e-filing system, introduced in 2017, has transformed how cases are filed and managed. The e-filing system has increased transparency and reduced the time required for case processing. The Kenyan Judiciary's annual report states, "The e-filing system has reduced case processing times by 50% and has significantly improved access to justice for remote communities" (Kenya Judiciary, 2020). This initiative is part of Kenya's broader digital transformation strategy to make justice more accessible and efficient.
Challenges in Implementing ICT in Legal Systems
Despite the potential benefits, implementing ICT in legal systems, especially in developing countries, faces several challenges. These include inadequate digital infrastructure, low levels of digital literacy, and resistance to change among legal professionals. A study by the International Development Law Organization (IDLO) highlights that "lack of digital infrastructure and skills remains a significant barrier to the effective use of ICT in the justice sector, particularly in low-income countries" (International Development Law Organization, 2020).
Addressing these challenges requires a multifaceted approach, including investment in digital infrastructure, capacity building for legal professionals, and public awareness campaigns. Integrating user-friendly technologies and developing scalable solutions are crucial for ensuring that ICT initiatives are inclusive and sustainable.
ICT in the Judicial System in India
The Tele-Law scheme in India aims to leverage ICT to provide legal assistance to marginalized communities. By establishing CSCs across rural areas, the scheme facilitates remote consultations with legal professionals through video conferencing. This section reviews the implementation process, critical metrics for evaluating CSC effectiveness, and the scheme's impact on access to justice.
The National Policy and Action Plan for implementing Information and Communication Technology (ICT) in the Indian Judiciary, prepared by the E-Committee of the Supreme Court of India (2005, August 1), outlines a comprehensive strategy to enhance judicial productivity, accessibility, cost-effectiveness, transparency, and accountability through ICT. The rationale for the introduction of ICT was to:
- Enhance Judicial Productivity Both qualitatively and quantitatively.
- Make Justice Affordable and Accessible: Reducing costs and enhancing transparency and accountability.
- Change Management: Re-engineering judicial processes and optimizing human resources.
ICT implementation Strategies included ICT infrastructure creation, judicial portal, E-mail Services, customized software development, training, capacity building, and digital archives and record management. The implementation was planned in three phases (2005, August 1). The objective of implementing ICT is "to enhance judicial productivity both qualitatively and quantitatively as also make the justice delivery system affordable, accessible, cost-effective, transparent, and accountable." (2005, August 1). To achieve this objective, the Tele-Law scheme was implemented in 2017.
Tele-Law Scheme
The Indian legal system, while comprehensive, has historically struggled to cater to the needs of marginalized communities and individuals living in remote, rural areas. Factors such as geographical barriers, socioeconomic disparities, and limited legal awareness have hindered the accessibility of legal services for these vulnerable groups. The Tele-Law scheme, launched in 2017, seeks to bridge this gap by providing remote legal assistance through video conferencing and telephone-based consultations. The Tele-law scheme has emerged as a promising initiative to bridge the legal access gap for marginalized communities and citizens residing in rural areas of India. As of date, the Tele-Law scheme, introduced by the Government of India in 2017, has significantly improved access to legal aid and justice for marginalized communities and citizens residing in rural areas.
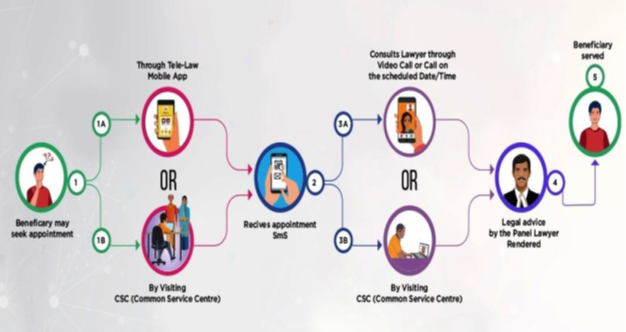
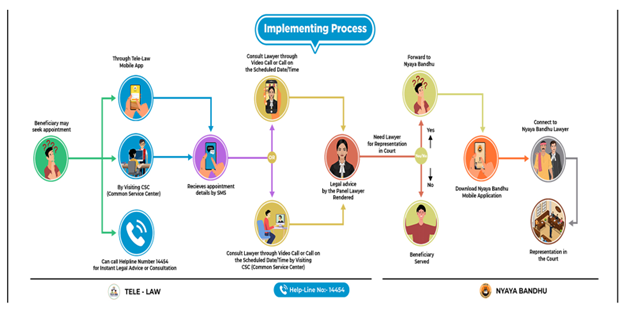
The implementation process of the Tele-Law scheme in India heavily leverages Information and Communication Technology (ICT) to provide legal assistance to rural and marginalized communities. The process starts with establishing Community Service Centers (CSCs) equipped with video conferencing facilities strategically placed in rural areas to serve as access points for citizens seeking legal advice. These centers are staffed by Village Level Entrepreneurs (VLEs) who assist beneficiaries in registering their cases on the Tele-Law portal.
Citizens visit the CSCs, where VLEs use ICT tools to help them register their legal issues on the portal. The cases are then electronically assigned to panel lawyers based on the nature of the legal problem. Panel lawyers, part of the Tele-Law network, provide legal advice and consultations through video conferencing or telephone calls, thus eliminating the need for physical travel and reducing associated costs. This technology-driven approach ensures efficient and timely delivery of legal assistance. The system also includes an ICT-based feedback mechanism to continuously improve service delivery and address any issues the beneficiaries face, making the process robust and user-friendly. By integrating ICT at every step, the Tele-Law scheme bridges the gap in access to justice, ensuring that legal support is readily available to underserved populations.
The steps citizens seeking legal advice and counseling from lawyers go through in the Tele-Law scheme are identified in Figure 1.
Process of Implementing Tele-Law
Implementation of Tele-Law Scheme
Implementation of the Tele-law scheme has faced several challenges that must be addressed to ensure its long-term success and effectiveness. Table 1 shows the Tele-Law scheme's key challenges and potential solutions to address them. In the years since the introduction of Tele-Law in 2017, the government of India significantly improved the implementation of the Tele-Law scheme to eradicate these challenges by adopting the recommended measures.
Tele-Law Implementation Challenges and Potential Solutions
|
IMPLEMENTATION DIMENSION |
CHALLENGE |
POTENTIAL SOLUTION |
|
Many potential beneficiaries, especially in remote and underserved areas, are unaware of the Tele-Law scheme and its services (Srivastava & Sharma, 2018). |
Enhance awareness campaigns and community outreach programs to educate citizens about the Tele-Law scheme and its benefits. Leverage local stakeholders, such as Panchayat members and community leaders, to disseminate information. |
|
|
Technological Barriers |
Access to stable internet connectivity and reliable communication devices remains a significant challenge in many rural areas, hampering the effective delivery of Tele-Law services (Yadav & Chopra, 2021) |
Strengthen the digital infrastructure in rural areas by expanding broadband connectivity and providing subsidized access to communication devices. Explore alternative communication methods, such as toll-free helplines, to reach those without internet access. |
|
The diversity of languages and cultural nuances across different regions of India pose challenges in effectively communicating legal information and advice. (Bhattacharya & Nandi, 2019) |
Recruit and train a diverse pool of legal advisors who can communicate in local languages and understand the cultural contexts of the communities they serve. Develop multilingual resources and tools to facilitate better understanding and engagement. |
|
|
Limited Legal Expertise |
The availability of qualified and experienced legal professionals to provide remote legal counseling through the Tele-Law scheme is often limited, particularly in rural areas (National Legal Services Authority, 2019) |
Incentivize and encourage more legal professionals to participate in the Tele-Law scheme, potentially through financial or career advancement opportunities. Provide comprehensive training and resources to build the capacity of legal advisors. |
|
Effective monitoring and evaluation of the Tele-Law scheme's impact and outcomes remain challenging, hindering the ability to identify and address shortcomings (Ministry of Law and Justice, Government of India, 2017) |
Develop a robust monitoring and evaluation framework, leveraging data analytics and user feedback, to track the scheme's performance and identify areas for improvement. Regularly assess the scheme's reach, service quality, and user. |
Tele-Law and Mobile Law Services
Tele-law and mobile law services leverage technology to provide legal assistance. Tele-Law primarily relies on video-conferencing at CSCs, whereas mobile law services offer direct access through smartphone applications. Mobile Law services were introduced in India in 2021 to overcome the challenges discussed earlier and enhance access to legal services. In India, Tele-Law and mobile law services aim to improve access to legal information and advice, especially for marginalized sections of society. Table 2 shows the differences between these two services.
Table 2
Tele-Law vs. Mobile Law
|
DIMENSION |
TELE-LAW |
MOBILE LAW |
|
Definition |
Tele-law refers to using communications and information technology to deliver legal information and advice. |
Mobile law services refer to legal assistance provided through mobile applications. |
|
Infrastructure |
It utilizes video-conferencing infrastructure available at Common Service Centers (CSCs) for e-interactions between lawyers and people. |
These services are accessible via mobile apps (available on Android and iOS devices). |
|
Reach |
Tele-Law aims to provide legal assistance to those who do not have a platform to express their grievances. It facilitates remote consultations and advice. |
Mobile law services can cover the entire population, as they can be downloaded and used on smartphones. |
|
Beneficiaries |
The service targets individuals who can access CSCs and engage in video interactions with lawyers. |
Users can access legal information, seek advice, and receive notifications directly on mobile devices. |
|
Launch Date |
2017 |
2021 (Mobile Version of Tele-Law) |
Method
Starting with a pilot program in December 2017, the Tele-Law scheme was expanded in stages to cover the entire country by 2023 with 250000 CSCs. Tele-Law scheme is an effort to make legal aid accessible to marginalized communities and citizens residing in rural areas. Women, children, and people belonging to Scheduled Caste (SC) and Scheduled Tribe (ST) communities entitled to free legal advice under the Legal Services Authorities Act of 1987 are the primary beneficiaries of the legal services provided through the Tele-Law scheme.
This study analyzes data from the Tele-Law program from January 2020 to December 2023, the period for which information is available for the entire year. Data were collected from government reports, publications, and official Tele-Law program records. Given the purpose of the study to examine access to justice for the vulnerable sections of the population, the following analyses were conducted on the Tele-Law data.
First, we examine the number of cases registered across states and the growth in cases filed by women and marginalized caste groups from 2020 to 2023. Cases resolved for caste groups and marginalized populations through the Tele-Law scheme are examined next. Finally, growth trends in the case categories identified by the Tele-Law scheme across gender and caste groups are discussed. We used SPSS and Excel statistical tools for data analysis and visualization.
Results
Results from data analysis are presented in the next section. Results are organized by the status of cases (filed and resolved), states, gender, caste categories, marginalized populations, and case categories.
Tele-Law Implementation by States
Trends were analyzed, and the rate of increase in the number of cases registered from 2020 to 2023 for legal services in India was calculated. This analysis provides a comprehensive view of the trends in the legal services sector in India over the 2020-2023 period.
Percentage Increase in Statewide Cases Registered by Gender and by Caste from 2020-2023
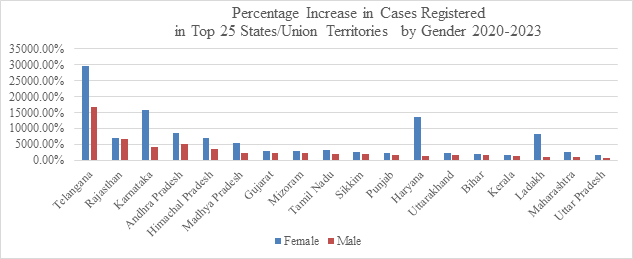
Table 3 shows the percentage increase in cases registered statewide by gender, and Figure 2 shows the percentage increase in cases registered in the top 10 states. Table 4 shows the percentage increase in cases registered statewide by caste, and Figure 3 shows the percentage increase in cases registered by caste in the top 10 states. The States/Union Territories (UTs) for which the 2020 data is unavailable are omitted from the analysis.
The Percentage Increase of Cases Registered by Gender
The Percentage Increase of Cases Registered by Caste
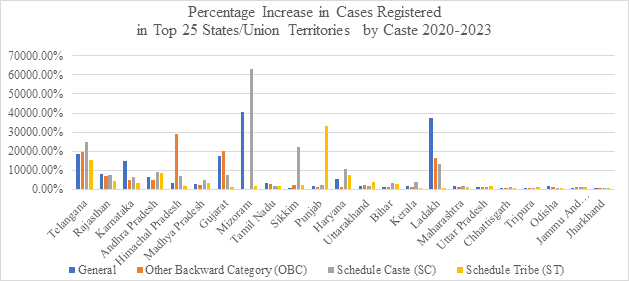
Table 3
Percentage Increase in The Number of Cases Registered Statewide by Gender From 2020 To 2023
(States with Incomplete Data Omitted)
|
States/Union Territories |
Percentage Increase by Gender |
||
|
|
Female |
Male |
Total |
|
Telangana |
29606.25% |
16714.46% |
19676.86% |
|
Rajasthan |
7033.79% |
6541.11% |
6664.00% |
|
Karnataka |
15650.61% |
4282.95% |
6377.15% |
|
Andhra Pradesh |
8525.97% |
4989.59% |
5226.52% |
|
Himachal Pradesh |
6944.29% |
3634.09% |
4328.94% |
|
Madhya Pradesh |
5545.92% |
2418.05% |
3020.62% |
|
Gujarat |
2849.65% |
2403.76% |
2518.67% |
|
Mizoram |
2953.20% |
2156.51% |
2495.92% |
|
Tamil Nadu |
3194.16% |
1800.60% |
2339.64% |
|
Sikkim |
2696.15% |
1899.73% |
2173.21% |
|
Punjab |
2293.71% |
1685.54% |
1968.99% |
|
Haryana |
13554.90% |
1420.99% |
1900.21% |
|
Uttarakhand |
2105.64% |
1629.63% |
1744.34% |
|
Bihar |
2022.78% |
1480.19% |
1705.35% |
|
Kerala |
1563.34% |
1347.50% |
1565.63% |
|
Ladakh |
8323.08% |
889.60% |
1411.29% |
|
Maharashtra |
2713.46% |
1088.66% |
1347.24% |
|
Uttar Pradesh |
1718.13% |
844.00% |
1064.11% |
|
Chhattisgarh |
1080.32% |
702.56% |
806.16% |
|
Tripura |
726.74% |
685.58% |
700.67% |
|
Odisha |
536.23% |
762.66% |
670.77% |
|
Jammu And Kashmir |
709.73% |
643.11% |
661.65% |
|
Jharkhand |
832.74% |
499.84% |
597.59% |
|
Arunachal Pradesh |
517.71% |
380.52% |
459.61% |
|
West Bengal |
430.72% |
397.64% |
410.01% |
|
Assam |
192.80% |
281.71% |
244.95% |
|
Nagaland |
169.76% |
177.54% |
174.01% |
|
Meghalaya |
137.30% |
115.74% |
124.85% |
|
Manipur |
154.46% |
108.38% |
124.83% |
The main conclusions from this analysis are:
· The overall increase in the number of cases registered from 2020 to 2023 is 1128.67%.
· The highest percentage increase is seen in Telangana (19676.86%), and the lowest is in Manipur (124.83%).
· For the gender-wise breakdown, the increase is higher for females than males in most states.
· The increase in the caste category-wise breakdown is the highest for the ST category in many states.
Percentage Increase in The Number of Cases Registered Statewide by Caste From 2020 To 2023
(States with Incomplete Data Omitted)
|
States/Union Territories |
Percentage Increase by Caste Category |
||||
|
General |
Other Backward Classes (OBC) |
Schedule Caste (SC) |
Schedule Tribe (ST) |
Total |
|
|
Telangana |
18456.62% |
19696.17% |
24827.14% |
15297.58% |
19676.86% |
|
Rajasthan |
8109.19% |
6766.38% |
7441.54% |
4086.33% |
6664.00% |
|
Karnataka |
14581.20% |
4821.95% |
6472.14% |
2993.36% |
6377.15% |
|
Andhra Pradesh |
6312.98% |
4649.51% |
9129.95% |
8199.44% |
5226.52% |
|
Himachal Pradesh |
3273.04% |
29133.96% |
6735.48% |
1677.55% |
4328.94% |
|
Madhya Pradesh |
2419.78% |
2104.38% |
4857.14% |
3447.13% |
3020.62% |
|
Gujarat |
17433.64% |
19928.99% |
7345.54% |
1204.48% |
2518.67% |
|
Tamil Nadu |
3064.71% |
2756.90% |
1716.89% |
1545.95% |
2339.64% |
|
Sikkim |
783.93% |
2059.38% |
22325.00% |
2235.00% |
2173.21% |
|
Punjab |
1587.74% |
1230.93% |
1893.59% |
33117.50% |
1968.99% |
|
Haryana |
5239.96% |
912.16% |
10512.84% |
7568.57% |
1900.21% |
|
Uttarakhand |
1780.08% |
2139.48% |
1468.27% |
3641.18% |
1744.34% |
|
Bihar |
856.64% |
1188.57% |
3320.76% |
2651.23% |
1705.35% |
|
Kerala |
1557.41% |
1279.67% |
3699.25% |
692.08% |
1565.63% |
|
Ladakh |
37200.00% |
16433.33% |
13033.33% |
559.55% |
1411.29% |
|
Maharashtra |
1444.05% |
1140.52% |
1652.35% |
1079.58% |
1347.24% |
|
Uttar Pradesh |
1293.74% |
838.24% |
1198.55% |
1494.52% |
1064.11% |
|
Chhattisgarh |
622.12% |
761.48% |
1024.14% |
780.39% |
806.16% |
|
Tripura |
446.33% |
707.08% |
800.35% |
927.36% |
700.67% |
|
Odisha |
1706.80% |
975.57% |
571.71% |
435.34% |
670.77% |
|
Jammu And Kashmir |
442.94% |
1205.63% |
1286.11% |
1230.16% |
661.65% |
|
Jharkhand |
766.73% |
592.64% |
756.11% |
440.54% |
597.59% |
|
Arunachal Pradesh |
420.57% |
2724.49% |
5135.80% |
50.30% |
459.61% |
|
West Bengal |
338.68% |
395.41% |
636.83% |
369.37% |
410.01% |
|
Assam |
192.79% |
287.92% |
922.08% |
404.85% |
244.95% |
|
Nagaland |
106.82% |
413.46% |
895.18% |
168.09% |
174.01% |
|
Meghalaya |
160.81% |
688.37% |
337.74% |
114.29% |
124.85% |
|
Manipur |
420.51% |
30.14% |
459.26% |
198.14% |
124.83% |
Percentage of Statewide Cases registered by Gender and Caste in 2020 and 2023
For 2020, the percentage of statewide cases registered by gender is shown in Table 5, and the percentage of cases registered by caste is shown in Table 6. For 2023, the percentage of statewide cases registered by gender is shown in Table 7, and the percentage of cases registered by caste is shown in Table 8. This detailed breakdown offers valuable insights into the distribution of legal services across vulnerable groups in India between 2020 and 2023.
Statewide Cases Registered by Gender for 2020
|
States/Union Territories |
Registered cases by Gender |
|
|
Female |
Male |
|
|
Andaman And Nicobar |
39.95% |
60.05% |
|
Andhra Pradesh |
32.72% |
67.28% |
|
Arunachal Pradesh |
55.09% |
44.91% |
|
Assam |
41.76% |
58.24% |
|
Bihar |
37.65% |
62.35% |
|
Chhattisgarh |
27.42% |
72.58% |
|
Gujarat |
25.88% |
74.12% |
|
Haryana |
3.87% |
96.13% |
|
Himachal Pradesh |
20.81% |
79.19% |
|
Jammu & Kashmir |
27.69% |
72.31% |
|
Jharkhand |
29.31% |
70.69% |
|
Karnataka |
18.48% |
81.52% |
|
Kerala |
54.77% |
45.23% |
|
Ladakh |
7.00% |
93.00% |
|
Madhya Pradesh |
16.23% |
83.77% |
|
Maharashtra |
15.88% |
84.12% |
|
Manipur |
35.31% |
64.69% |
|
Meghalaya |
42.11% |
57.89% |
|
Mizoram |
42.52% |
57.48% |
|
Nagaland |
46.28% |
53.72% |
|
Odisha |
40.61% |
59.39% |
|
Punjab |
30.49% |
69.51% |
|
Rajasthan |
29.71% |
70.29% |
|
Sikkim |
34.82% |
65.18% |
|
Tamil Nadu |
38.73% |
61.27% |
|
Telangana |
22.46% |
77.54% |
|
Tripura |
40.62% |
59.38% |
|
Uttar Pradesh |
25.19% |
74.81% |
|
Uttarakhand |
24.45% |
75.55% |
|
West Bengal |
38.21% |
61.79% |
The main conclusions from this analysis are:
· The gender-wise breakup from Tables 5 and 7 shows that the share of female cases has increased in most states from 2020 to 2023.
· For the caste category-wise breakup- from Tables 6 and 8, the share of cases from the General and ST categories has increased in many states. In contrast, the share of OBC and SC categories has remained relatively stable or decreased slightly.
· Some states like Gujarat, Ladakh, Lakshadweep, and Mizoram have seen a significant increase in the share of ST category cases.
· States like Uttar Pradesh, Rajasthan, and Madhya Pradesh continue to have a higher share of SC and OBC cases than General and ST categories.
Statewide Cases Registered by Caste for 2020
|
States/Union Territories
|
Registered cases by Caste |
|||
|
General |
Other Backward Category (OBC) |
Schedule Caste (SC) |
Schedule Tribe (ST) |
|
|
Andaman And Nicobar |
10.58% |
11.94% |
75.48% |
2.00% |
|
Andhra Pradesh |
28.16% |
38.77% |
14.62% |
6.45% |
|
Arunachal Pradesh |
30.28% |
3.03% |
4.26% |
62.43% |
|
Assam |
76.64% |
15.13% |
3.93% |
3.89% |
|
Bihar |
21.12% |
54.84% |
19.67% |
4.19% |
|
Chhattisgarh |
8.48% |
38.45% |
19.07% |
34.00% |
|
Gujarat |
2.07% |
3.24% |
6.02% |
88.67% |
|
Haryana |
6.80% |
85.40% |
5.73% |
1.47% |
|
Himachal Pradesh |
42.02% |
2.53% |
23.96% |
30.49% |
|
Jammu & Kashmir |
72.92% |
8.38% |
12.10% |
6.60% |
|
Jharkhand |
8.62% |
51.70% |
15.74% |
24.03% |
|
Karnataka |
14.94% |
46.42% |
24.06% |
14.58% |
|
Kerala |
29.00% |
56.88% |
6.25% |
7.88% |
|
Ladakh |
1.08% |
1.61% |
1.61% |
95.70% |
|
Madhya Pradesh |
15.19% |
47.88% |
22.01% |
14.92% |
|
Maharashtra |
16.62% |
19.51% |
33.92% |
29.95% |
|
Manipur |
6.82% |
60.31% |
4.72% |
28.15% |
|
Meghalaya |
8.56% |
0.33% |
1.98% |
89.13% |
|
Mizoram |
0.51% |
0.00% |
0.34% |
99.15% |
|
Nagaland |
4.59% |
1.08% |
0.87% |
93.46% |
|
Odisha |
6.69% |
17.75% |
40.00% |
35.56% |
|
Punjab |
28.31% |
10.46% |
60.90% |
0.41% |
|
Rajasthan |
19.01% |
34.45% |
26.72% |
19.82% |
|
Sikkim |
50.00% |
28.57% |
3.57% |
17.86% |
|
Tamil Nadu |
28.01% |
31.10% |
33.15% |
7.75% |
|
Telangana |
19.08% |
43.91% |
19.65% |
17.37% |
|
Tripura |
27.78% |
26.41% |
27.14% |
18.67% |
|
Uttar Pradesh |
16.33% |
44.66% |
35.23% |
3.77% |
|
Uttarakhand |
21.14% |
23.58% |
52.98% |
2.29% |
|
West Bengal |
54.84% |
21.57% |
19.56% |
3.95% |
Table 7
Percentage of Statewide cases Registered by Gender for 2023
|
States/Union Territories |
Cases Registered by Gender |
||
|
Female |
Male |
Total |
|
|
Andaman And Nicobar |
42.41% |
57.59% |
100% |
|
Andhra Pradesh |
46.62% |
53.38% |
100% |
|
Arunachal Pradesh |
61.43% |
38.57% |
100% |
|
Assam |
35.51% |
64.49% |
100% |
|
Bihar |
45.35% |
54.65% |
100% |
|
Chhattisgarh |
35.60% |
64.40% |
100% |
|
Dadra And Nagar Haveli & Daman & Diu |
24.26% |
75.74% |
100% |
|
Delhi |
45.37% |
54.63% |
100% |
|
Goa |
40.77% |
59.23% |
100% |
|
Gujarat |
28.96% |
71.04% |
100% |
|
Haryana |
27.16% |
72.84% |
100% |
|
Himachal Pradesh |
33.43% |
66.57% |
100% |
|
Jammu And Kashmir |
29.45% |
70.55% |
100% |
|
Jharkhand |
39.25% |
60.75% |
100% |
|
Karnataka |
44.91% |
55.09% |
100% |
|
Kerala |
58.26% |
41.74% |
100% |
|
Ladakh |
39.02% |
60.98% |
100% |
|
Lakshadweep |
45.54% |
54.46% |
100% |
|
Madhya Pradesh |
30.24% |
69.76% |
100% |
|
Maharashtra |
30.85% |
69.15% |
100% |
|
Manipur |
39.95% |
60.05% |
100% |
|
Meghalaya |
44.43% |
55.57% |
100% |
|
Mizoram |
50.13% |
49.87% |
100% |
|
Nagaland |
45.56% |
54.44% |
100% |
|
Odisha |
33.54% |
66.46% |
100% |
|
Puducherry |
36.54% |
63.46% |
100% |
|
Punjab |
37.08% |
62.92% |
100% |
|
Rajasthan |
31.04% |
68.96% |
100% |
|
Sikkim |
42.79% |
57.21% |
100% |
|
Tamil Nadu |
52.32% |
47.68% |
100% |
|
Telangana |
33.66% |
66.34% |
100% |
|
Tripura |
41.92% |
58.08% |
100% |
|
Uttar Pradesh |
39.37% |
60.63% |
100% |
|
Uttarakhand |
29.21% |
70.79% |
100% |
|
States/Union Territories |
Cases Registered by Caste |
|||
|
|
General |
Other Backward Category (OBC) |
Schedule Caste (SC) |
Schedule Tribe (ST) |
|
Andaman And Nicobar |
11.14% |
12.71% |
79.84% |
2.26% |
|
Andhra Pradesh |
33.22% |
33.09% |
24.62% |
9.07% |
|
Arunachal Pradesh |
28.07% |
15.28% |
39.95% |
16.70% |
|
Assam |
65.42% |
17.13% |
11.76% |
5.69% |
|
Bihar |
12.11% |
41.37% |
39.70% |
6.82% |
|
Chhattisgarh |
6.79% |
36.44% |
23.61% |
33.16% |
|
Dadra And Nagar Haveli & Daman & Diu |
68.85% |
10.61% |
14.52% |
5.97% |
|
Delhi |
15.67% |
49.51% |
32.55% |
2.25% |
|
Goa |
51.67% |
12.91% |
30.52% |
4.93% |
|
Gujarat |
13.83% |
24.89% |
17.18% |
44.11% |
|
Haryana |
18.81% |
43.09% |
32.42% |
5.67% |
|
Himachal Pradesh |
32.32% |
18.26% |
37.31% |
12.12% |
|
Jammu And Kashmir |
51.83% |
14.33% |
22.15% |
11.69% |
|
Jharkhand |
10.74% |
51.48% |
19.40% |
18.37% |
|
Karnataka |
33.72% |
35.22% |
24.06% |
6.98% |
|
Kerala |
30.74% |
50.20% |
15.17% |
3.99% |
|
Ladakh |
26.55% |
17.65% |
13.98% |
41.82% |
|
Lakshadweep |
11.95% |
19.09% |
68.83% |
0.19% |
|
Madhya Pradesh |
12.15% |
34.95% |
35.59% |
17.59% |
|
Maharashtra |
17.76% |
16.72% |
41.16% |
24.36% |
|
Manipur |
15.84% |
35.04% |
11.76% |
37.36% |
|
Meghalaya |
9.96% |
1.16% |
4.29% |
84.59% |
|
Mizoram |
7.95% |
26.00% |
8.28% |
57.77% |
|
Nagaland |
3.46% |
2.04% |
3.15% |
91.35% |
|
Odisha |
15.66% |
24.76% |
34.93% |
24.65% |
|
Puducherry |
18.06% |
45.54% |
34.83% |
1.60% |
|
Punjab |
24.26% |
7.06% |
61.59% |
7.14% |
|
Rajasthan |
23.00% |
35.07% |
29.74% |
12.19% |
|
Sikkim |
19.43% |
27.08% |
35.20% |
18.33% |
|
Tamil Nadu |
35.11% |
35.11% |
24.63% |
5.25% |
|
Telangana |
17.78% |
44.10% |
24.64% |
13.46% |
|
Tripura |
18.93% |
26.62% |
30.54% |
23.92% |
|
Uttar Pradesh |
19.57% |
36.00% |
39.32% |
5.16% |
|
Uttarakhand |
21.58% |
28.65% |
45.12% |
4.78% |
|
West Bengal |
47.23% |
20.91% |
28.25% |
3.64% |
Percentage of Statewide Cases Registered by Caste 2023
Caste Categories and Caste Groups Cases Resolved from 2020 to 2023
In India, for legal services from 2020 to 2023, the percentage increase in cases resolved by caste categories is shown in Table 9. The percentage increase in cases resolved by caste groups is shown in Table 10.
The main conclusions from this analysis are:
· The overall increase in cases resolved from 2020 to 2023 is 1128.67%.
· The highest percentage increase for the caste category-wise breakdown is seen in the SC category at 1658.47%, followed by OBC at 1159.21%, ST at 890.38%, and General at 846.89%.
· The percentage increase for the marginalized category (OBC, SC, ST) is 1245.63%, significantly higher than the increase for the General category at 846.89%.
· This indicates that legal services have become more accessible and utilized by the marginalized sections of society during this period.
The analysis provides a clear picture of the trends in the distribution and resolution of legal cases across different demographic groups in India over the 2020-2023 period. This information can be valuable for policymakers and legal aid organizations to understand the progress made in reaching marginalized communities and identifying areas for further improvement.
|
Caste Category |
2020 |
2023 |
Percentage Increase |
|
General |
155,528 |
1,472,517 |
846.89% |
|
OBC |
161,287 |
2,030,500 |
1159.21% |
|
SC |
119,141 |
2,093,285 |
1658.47% |
|
ST |
98,707 |
977,963 |
890.38% |
|
Total |
534,663 |
6,574,265 |
1128.67% |
Percentage Increase in Cases Resolved across Caste Categories
Percentage Increase in Cases Resolved across Caste Groups
|
Caste Group |
2020 |
2023 |
Percentage Increase |
|
General |
155,528 |
1,472,517 |
846.89% |
|
Marginalized (OBC, SC, ST) |
379,135 |
5,101,748 |
1245.63% |
|
Total |
534,663 |
6,574,265 |
1128.67% |
Percentage Change in Marginalized Category Cases Resolved from 2020 to 2023
The Tele-Law scheme identifies several marginalized categories of people targeted for service. Table 11 displays these categories and shows the percentage increase in cases resolved for each category during the last four years.
The main conclusion from this analysis are:
· The overall increase in marginalized category cases resolved from 2020 to 2023 is 1130.88%.
· The highest percentage increase is seen in the "Children (Below 18 years of age)" category at 3027.43%, followed by "Mentally ill and differently-abled" at 1646.72% and "Victims of Trafficking" at 1947.34%.
· The "SC/ST" category, which had the highest number of cases in 2020, also saw a significant increase of 1033.03%.
· The "People with low-income groups" and "Women" categories have the lowest percentage increases at 856.53% and 821.81%, respectively, but still show substantial growth.
· The "Other than above" category, which includes cases that do not fall under the defined marginalized categories, also saw a significant increase of 1670.95%.
Percentage Increase in Cases Resolved Across Marginalized Categories from 2020- 2023
|
Marginalized Category |
2020 |
2023 |
Percentage Increase |
|
Children (Below 18 years of age) |
5,823 |
182,092 |
3027.43% |
|
Mentally ill and differently-abled |
2,766 |
48,283 |
1646.72% |
|
People with low-income groups (Income as specified by State) |
39,107 |
374,154 |
856.53% |
|
SC/ST |
160,744 |
1,823,063 |
1033.03% |
|
Under trials/In Custody |
1,874 |
26,794 |
1330.99% |
|
Victims of Natural Disaster/Ethnic Violence |
3,536 |
38,549 |
989.94% |
|
Victims of Trafficking |
4,208 |
86,162 |
1947.34% |
|
Women |
160,317 |
1,477,855 |
821.81% |
|
Workers in Unorganized Sector |
27,101 |
286,646 |
958.16% |
|
Other than above |
120,656 |
2,136,671 |
1670.95% |
|
Total |
526,132 |
6,480,269 |
1130.88% |
Number of Marginalized Category Cases Resolved from 2020 to 2023
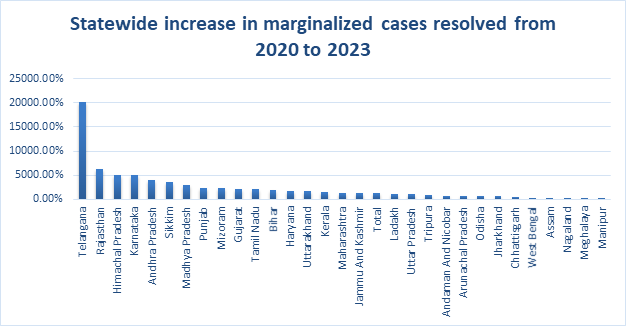
Table 12 shows the statewide increase in marginalized cases resolved from 2020 to 2023. Figure 4 shows the increase in the statewide marginalized cases resolved from 2020 to 2023.
The main conclusions from this analysis are:
· • The overall increase in marginalized category cases resolved from 2020 to 2023 is 1245.63%.
· • At the state level, the highest percentage increase in marginalized category cases is seen in Telangana (20221.66%), followed by Rajasthan (6338.35%) and Karnataka (5039.92%).
· • For the caste category-wise breakdown, the highest percentage increase is seen in the SC category at 1658.47%, followed by OBC at 1159.21%, ST at 890.38%, and General at 846.89%.
· This analysis provides a comprehensive understanding of the trends in resolving legal cases for various marginalized groups in India from 2020 to 2023. The results suggest that there has been a concerted effort to improve access to legal services for these vulnerable communities during this period.
|
States/Union Territories |
2020 |
2023 |
Percentage Increase |
|
Telangana |
577 |
116,919 |
20221.66% |
|
Rajasthan |
4,944 |
318,277 |
6338.35% |
|
Himachal Pradesh |
1,106 |
57,485 |
5100.45% |
|
Karnataka |
2,637 |
133,084 |
5039.92% |
|
Andhra Pradesh |
1,347 |
54,971 |
3982.63% |
|
Sikkim |
56 |
2,054 |
3568.75% |
|
Madhya Pradesh |
20,117 |
629,132 |
3028.82% |
|
Punjab |
5,959 |
148,271 |
2387.48% |
|
Mizoram |
585 |
14,048 |
2301.36% |
|
Gujarat |
10,394 |
240,807 |
2217.17% |
|
Tamil Nadu |
5,581 |
120,637 |
2061.96% |
|
Bihar |
16,773 |
343,147 |
1945.97% |
|
Haryana |
6,548 |
116,000 |
1670.83% |
|
Uttarakhand |
5,260 |
91,592 |
1641.97% |
|
Kerala |
910 |
13,883 |
1426.37% |
|
Maharashtra |
29,643 |
422,021 |
1324.52% |
|
Jammu And Kashmir |
13,357 |
179,908 |
1247.65% |
|
Total |
379,135 |
5,101,748 |
1245.63% |
|
Ladakh |
184 |
2,064 |
1019.57% |
|
Uttar Pradesh |
83,496 |
935,009 |
1019.27% |
|
Tripura |
6,142 |
54,228 |
783.68% |
|
Andaman And Nicobar |
262 |
2,210 |
743.51% |
|
Arunachal Pradesh |
1,080 |
7,518 |
596.67% |
|
Odisha |
31,078 |
216,513 |
596.45% |
|
Jharkhand |
48,709 |
330,646 |
578.44% |
|
Chhattisgarh |
30,248 |
199,009 |
558.05% |
|
West Bengal |
29,217 |
129,839 |
344.51% |
|
Assam |
57,854 |
201,431 |
248.07% |
|
Nagaland |
9,039 |
25,355 |
180.58% |
|
Meghalaya |
11,853 |
26,249 |
121.33% |
|
Manipur |
538 |
1,081 |
100.93% |
Statewide Increase in Marginalized Cases Resolved from 2020 to 2023
Statewide Increase in Marginalized Cases Resolved from 2020 to 2023
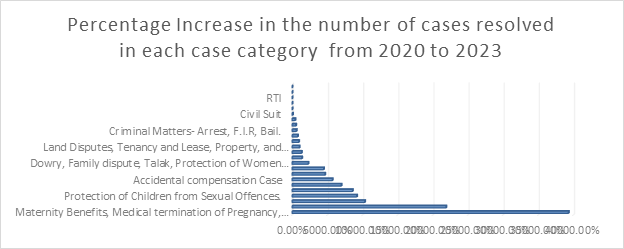
Percentage Change in Type of Cases Category Resolved from 2020 to 2023
The trends and the percentage increase in the types of cases categories resolved from 2020 to 2023 are shown in Table 13. Figure 5 shows the percentage increase in type of cases from 2020 to 2023.
The main conclusions from this analysis are:
· The overall increase in type of case categories resolved from 2020 to 2023 is 1131.24%.
· The highest percentage increase is seen in the "Maternity Benefits, Medical termination of Pregnancy, Prevention of misuse of Pre- and Post Natal" category at 39321.37%, followed by "Prohibition of Child Marriage" at 21891.76% and "Prevention of Atrocities Against Scheduled Caste and Scheduled Tribes" at 10337.71%.
· Several categories related to women's rights, child labor, and marginalized groups significantly increased, indicating a concerted effort to address these communities' issues.
· The "Delay or rejection in providing basic services matters" category had no change in the number of cases, suggesting this may be an area that requires further attention.
· The "Others" category, which includes a wide range of miscellaneous cases, also substantially increased by 941.08%.
This analysis provides a comprehensive view of the changing trends in the types of legal cases being resolved through the Tele-Law scheme from 2020 to 2023. It highlights the areas where significant progress has been made and potential areas for further improvement and targeted interventions.
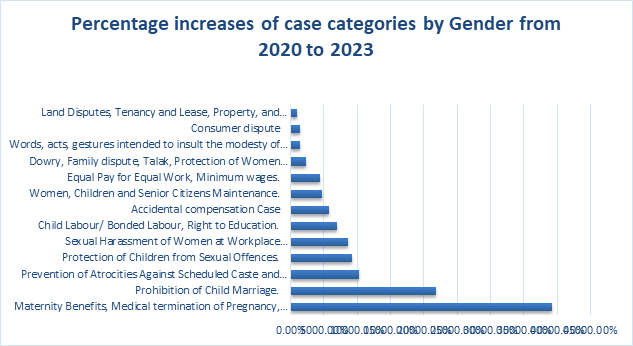
Tele-law Type of Case Categories by Caste and by Gender
Table 13 shows the percentage increases in types of case categories by caste from 2020 to 2023, and Table 14 shows the percentage increases in types of case categories by Gender for the same period. Figure 6 shows the type of case categories with four-digit (more than 1000) percentage increases from 2020 to 2023 by Gender, and Figure 7 shows the four-digit percentage increases of cases by caste.
The key insights from the updated analysis:
· The overall increase in case category cases resolved from 2020 to 2023 is 1131.24%.
· At the gender level, the percentage increase is generally higher for the female category than the male category across most case types.
· For the caste category-wise breakdown, the increases are the highest for the SC category in several cases, such as "Maternity Benefits, Medical termination of Pregnancy, Prevention of misuse of Pre- and Post Natal," "Prohibition of Child Marriage," and "Sexual Harassment of Women at Workplace."
· The ST category also significantly increases in case types, like "Accidental Compensation Case" and "Child Labor/ Bonded Labor, Right to Education."
One of the primary outcomes of the analysis is the data concerning the "Delay or rejection in providing basic services matters" category. As seen from Table 13, this category did not see any change in the number of cases from 2020 to 2023, which is a testament to the effectiveness of the Tele-law program. This comprehensive analysis provides a detailed understanding of the trends in different legal cases resolved through the Tele-Law scheme, accounting for gender and social category dimensions.
Percentage Increase in Case Category by Caste 2020-2023
|
Case Category |
Caste Category |
||||
|
|
General |
OBC |
SC |
ST |
Total |
|
Accidental Compensation Case |
2339.58% |
10551.72% |
12814.29% |
20418.18% |
5718.63% |
|
Child Labor/ Bonded Labor, Right to Education. |
9586.72% |
8986.30% |
10722.65% |
2661.10% |
6982.54% |
|
Civil Suit |
20.30% |
64.98% |
348.01% |
455.97% |
73.37% |
|
Consumer dispute |
630.88% |
2114.92% |
4900.00% |
3418.33% |
1338.55% |
|
Corporate matter |
391.89% |
942.86% |
4400.00% |
1600.00% |
787.50% |
|
Criminal Matters- Arrest, F.I.R, Bail. |
386.48% |
565.73% |
1112.50% |
447.65% |
597.81% |
|
Delay or rejection in providing basic services matters |
0.00% |
0.00% |
0.00% |
0.00% |
0.00% |
|
Dowry, Family dispute, Talak, Protection of Women Against Domestic Violence. |
1929.83% |
2535.76% |
3025.55% |
1661.48% |
2274.41% |
|
Equal Pay for Equal Work, Minimum wages. |
3394.65% |
8187.91% |
6881.30% |
1918.55% |
4483.99% |
|
Family, matrimonial, succession matters |
146.42% |
555.69% |
1765.52% |
452.68% |
417.62% |
|
|
General |
OBC |
SC |
ST |
Total |
|
Land Disputes, Tenancy and Lease, Property, and Inheritance rights. |
881.85% |
1191.54% |
1256.97% |
729.95% |
1016.11% |
|
Maternity Benefits, Medical termination of Pregnancy, Prevention of misuse of Pre- and Post-Natal. |
94647.06% |
66860.00% |
144727.27% |
9718.49% |
39321.37% |
|
Negligence matters |
0.00% |
3.23% |
2.50% |
2.17% |
1.53% |
|
Prevention of Atrocities Against Scheduled Caste and Scheduled Tribes. |
10044.44% |
17276.22% |
9566.87% |
7021.52% |
10337.71% |
|
Prohibition of Child Marriage. |
31422.64% |
39400.00% |
72487.78% |
5789.64% |
21891.76% |
|
Property dispute |
252.85% |
754.84% |
1887.40% |
796.27% |
523.92% |
|
Protection of Children from Sexual Offences. |
20873.33% |
12669.61% |
17334.78% |
2641.61% |
9186.36% |
|
RTI |
2.08% |
23.03% |
47.62% |
0.48% |
2.70% |
|
Service matter |
6.00% |
11.35% |
50.00% |
4.08% |
9.88% |
|
Sexual Harassment of Women at Workplace (Prevention & Prohibition). |
7625.71% |
16449.39% |
14850.00% |
3119.63% |
8586.62% |
|
Tenancy and lease-related matters |
1.42% |
4.62% |
10.96% |
20.00% |
3.61% |
|
Women, Children, and Senior Citizens Maintenance. |
5149.84% |
5445.94% |
5718.88% |
3001.92% |
4661.42% |
|
Words, acts, and gestures intended to insult the modesty of women, indecent representation of women. |
1287.42% |
1699.32% |
1383.53% |
1065.19% |
1377.28% |
|
Others(Scholarship, Aadhar card, bank loan, Incorrect Name, D-voters, Cheque Bounce, Electricity matter, PAN card, Labor matter) |
710.26% |
957.67% |
1365.53% |
740.71% |
941.08% |
|
Total |
844.18% |
1159.43% |
1677.14% |
886.77% |
1131.24% |
Rate of Increase in the Number of Cases Resolved in each Category of Cases from 2020 to 2023
Highest Percentage Increases of Case Categories by Gender from 2020 to 2023
Highest Percentage Increases of Case Categories by Caste from 2020 to 2023
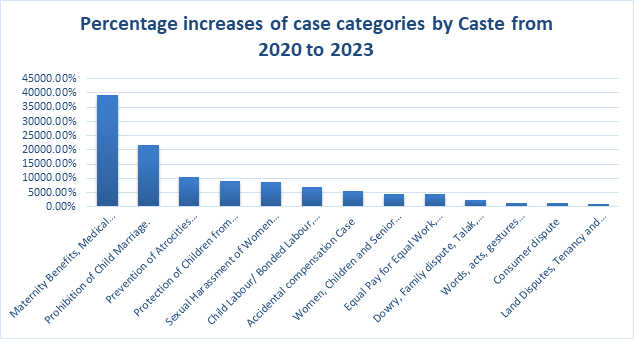
Table 14
Percentage Increases of Case Category by Gender 2020-2023
|
Case Category |
Gender |
||
|
Female |
Male |
Total |
|
|
Accidental Compensation Case |
12938.28% |
4199.67% |
5718.63% |
|
Child Labor/ Bonded Labor, Right to Education. |
9456.49% |
6076.08% |
6982.54% |
|
Civil Suit |
132.11% |
62.85% |
73.37% |
|
Consumer dispute |
2073.04% |
1119.92% |
1338.55% |
|
Corporate matter |
1520.00% |
628.26% |
787.50% |
|
Criminal Matters- Arrest, F.I.R, Bail. |
716.24% |
554.67% |
597.81% |
|
Delay or rejection in providing basic services matters |
0.00% |
0.00% |
0.00% |
|
Dowry, Family dispute, Talak, Protection of Women Against Domestic Violence. |
1846.52% |
2789.11% |
2274.41% |
|
Equal Pay for Equal Work, Minimum wages. |
6097.64% |
3964.83% |
4483.99% |
|
Family, matrimonial, succession matters |
248.67% |
685.28% |
417.62% |
|
Land Disputes, Tenancy and Lease, Property, and Inheritance rights. |
1518.30% |
891.98% |
1016.11% |
|
Maternity Benefits, Medical termination of Pregnancy, Prevention of misuse of Pre- and Post-Natal. |
27135.12% |
51713.13% |
39321.37% |
|
Negligence matters |
2.24% |
1.54% |
1.53% |
|
Prevention of Atrocities Against Scheduled Caste and Scheduled Tribes. |
13955.87% |
9059.37% |
10337.71% |
|
Prohibition of Child Marriage. |
21425.00% |
22166.81% |
21891.76% |
|
Property dispute |
743.70% |
450.37% |
523.92% |
|
Protection of Children from Sexual Offences. |
7454.70% |
10598.64% |
9186.36% |
|
RTI |
3.94% |
2.04% |
2.70% |
|
Service matter |
21.28% |
6.72% |
9.88% |
|
Sexual Harassment of Women at Workplace (Prevention & Prohibition). |
5228.87% |
16234.88% |
8586.62% |
|
Tenancy and lease-related matter |
5.18% |
2.82% |
3.61% |
|
Women, Children, and Senior Citizens Maintenance. |
3502.60% |
7664.75% |
4661.42% |
|
Words, acts, and gestures intended to insult the modesty of women, indecent representation of women. |
1753.80% |
1218.03% |
1377.28% |
|
Others(Scholarship, Aadhar card, bank loan, Incorrect Name, D-voters, Cheque Bounce, Electricity matter, PAN card, Labor matter) |
268.49% |
866.70% |
941.08% |
|
Total |
1359.29% |
1031.17% |
1131.24% |
Implications
A thorough analysis of trends in "Cases Registered" and "Advice Enabled" from the Tele Law Monthly Progress Reports for 2020 through 2023 was conducted. Table 15 summarizes the findings, and Table 16 summarizes the specific observations for each year.
The implications of the analysis of Tele-law reports from 2020-2023 are:
- Efficacy of Digital Tools: The increase in cases registered and advice enabled through digital platforms underscores the success of incorporating technology into legal services, making them more accessible to the broader public.
- Need for Continued Outreach: The correlation between training/awareness activities and case/advice numbers suggests that continued investment in these areas could further enhance service uptake.
- Regional Focus: Tailoring strategies to fit regional needs, especially in less active states, could help balance service utilization nationwide.
This analysis demonstrates the growing impact and critical role of Tele Law services in providing legal assistance, particularly to underserved populations in rural and remote areas. Continued monitoring and adaptive strategies based on these trends will be essential for maximizing the outreach and efficacy of these services moving forward.
Cases Registered and Advice Enabled Trends (2020 - 2023)
|
Outcome Measures |
Description |
|
Increasing Volume |
Both "Cases Registered" and "Advice Enabled" show an upward trend in numbers from year to year. This suggests growing utilization and an expanding reach of Tele Law services. |
|
State Variations |
There are significant variations among states regarding the number of cases registered and advice enabled, with populous states generally showing higher activity levels. |
|
Impact of Awareness and Training |
Increased activities such as training sessions for village-level entrepreneurs (VLEs), Panel Lawyers, and community awareness programs correlate with higher registration and advice numbers, suggesting the effectiveness of these initiatives. |
Summary of the Specific Observations for the Years 2020-2023
|
Year |
Specific Observations |
|
2020 |
Many cases were registered and advised across all states, with notable activity in populous regions like Uttar Pradesh and Bihar. |
|
2021 |
The trend continues with increased registered cases and advice enabled, reflecting wider acceptance and possibly improving service outreach. |
|
2022 |
Further growth in the number of cases and advice sessions is observed. The reports also highlight the role of technological integrations, such as mobile and web platforms, in enhancing accessibility. |
|
2023 |
The latest data indicates a continued upward trajectory, with significant numbers indicating robust engagement with the Tele Law services. Integrating services through CSC and mobile apps continues to play a critical role. |
Discussion
The Tele-Law scheme has significantly improved legal aid accessibility for marginalized communities and citizens residing in rural areas of India. The data analysis reveals that the program has achieved a notable geographical reach, with a substantial presence in states with high populations and significantly marginalized demographics.
The demographic breakdown of Tele-Law users highlights the scheme's ability to cater to vulnerable groups. Most users are female and belong to socioeconomically disadvantaged categories such as Scheduled Castes, Scheduled Tribes, and Other Backward Classes. This suggests that the Tele-Law initiative successfully addresses the needs of those who have historically faced barriers in accessing legal services.
The case category analysis provides deeper insights into the effectiveness of the Tele-Law scheme. The relatively high success rates and user satisfaction levels across various legal issue categories indicate that the program delivers meaningful and impactful legal assistance to its beneficiaries. The scheme's ability to address a diverse range of legal matters, from land disputes to family matters, demonstrates its versatility and relevance in addressing the legal needs of marginalized communities.
The discussion highlights the positive impact of ICT on access to justice, particularly in rural and marginalized communities. The results show that the availability of CSCs and digital tools significantly enhances the efficiency and reach of legal services. However, digital literacy, infrastructure gaps, and systemic barriers persist. Addressing these issues is crucial for the continued success of the Tele-Law scheme.
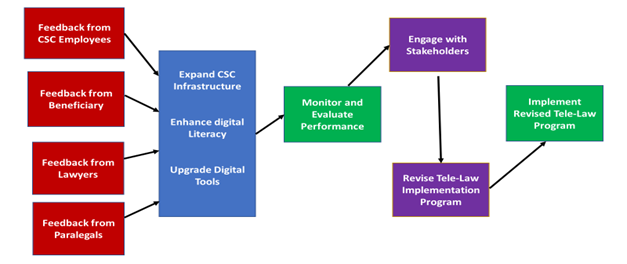
Conclusions and Recommendations
The Tele-Law scheme has emerged as a promising initiative to bridge the legal access gap for marginalized communities and citizens residing in rural areas of India. The comprehensive data analysis presented in this study highlights the scheme's remarkable progress in expanding its geographical reach, catering to underserved demographics, and delivering practical legal assistance. As the program evolves, further research and policy interventions should focus on integrating ICT into the Tele-Law program to enhance its reach, improve service quality, and ensure a sustainable long-term impact on the legal empowerment of marginalized populations in India. The specific recommendations include:
- Expand CSC Infrastructure: Increase the number and distribution of CSCs, particularly in underserved regions.
- Enhance Digital Literacy: Provide training programs for CSC staff and beneficiaries to improve digital literacy and familiarity with legal processes.
3. Upgrade Digital Tools: Invest in modern digital tools and platforms to streamline case management and improve service delivery.
- Monitor and Evaluate Performance: Implement robust monitoring and evaluation systems to track key metrics and identify areas for improvement.
- Engage with Stakeholders: Foster collaborations with government agencies, private sector partners, and community organizations to enhance the effectiveness of the Tele-Law scheme.
Figure 8 suggests a framework for incorporating the feedback received from various stakeholders into improving the global infrastructure by expanding infrastructure, enhancing digital literacy, and upgrading digital tools. The performance of the new global infrastructure should be monitored, and performance should be evaluated; the outcomes should be discussed with the stakeholders to revise the Tele-Law program, and a revised plan for implementing the Tele-Law scheme should be developed.
Revised Tele-Law Implementation Plan Process
Future Research
First, there are programs similar to tele-law programs in India that are currently prevalent in other parts of the world. A comparative study of such programs across the globe would provide insight into such successful socially acceptable programs. It would be a good learning ground for countries to learn from and benefit from one another.
Second, it would be helpful to conduct a comparative study of tele-law and mobile law programs and their impact on solving legal cases related to marginalized populations in rural parts of the country.
Recently, the Tele-law program implementation underwent a significant change with the incorporation of mobile applications, providing consulting to communities via video calls and revamping the process by re-engineering the workflow of the implementation process, as shown in Figure 9.
This should be particularly helpful since mobile law had only a small footprint during the period examined in the present research. Third, a study focusing on women's harassment issues can provide additional insight into the type of cases filed and will lead to the design of better technology tools to resolve such cases.
Finally, in addition to the above, further analysis on the following issues can bring additional understanding of the role of ICT and provide future guidance to implement Tele-law:
- Number of centers in each state over the last three years and their effectiveness
- Number and types of cases registered through mobile phone App
All the above efforts will provide a good picture of the possibilities for enhancing the contribution of the Tele-law scheme to the swift resolution of cases in the Indian Judicial system by using advanced and sophisticated communications and information technology tools.
Revised Tele-Law Implementation Process
The use of ICT in the legal and justice systems worldwide has demonstrated significant potential to enhance access to justice, improve efficiency, and reduce costs. The experiences of various countries illustrate the diverse ways technology can be leveraged to address challenges in the legal sector. The Tele-Law Program in India is a testament to the transformative power of ICT in making legal services accessible to marginalized communities. As technology continues to evolve, it is essential to address the existing challenges and explore innovative solutions to ensure that the benefits of ICT in the justice system are realized globally.
References
Australian Law Reform Commission. (2020, January 1). Digital Transformation in the Justice System. https://www.alrc.gov.au/implementation-final-reports/
Bhattacharya, S., & Nandi, A. (2019). Access to legal aid and justice: A study of the Tele-Law scheme in India. Economic and Political Weekly, 54(32), 33–40.
E-Committee of the Supreme Court of India. (2005, August 1). National policy and action plan for implementing information and communication technology (ICT) in the Indian Judiciary.
International Development Law Organization (2020, January 1). Digital justice: Challenges and opportunities. Tele-Law Reports.
Kenya Judiciary. (2020, January 1). Annual report on the implementation of the E-filing system.
Legal Services Corporation. (2020, January 1). Annual report on technology and legal aid. Annual Reports. https://www.lsc.gov/our-impact/publications/annual-reports
Ministry of Justice, United Kingdom. (2021, January 1). Digital strategy for the courts and tribunals. Ministry of Justice. Justice.
Ministry of Law and Justice, Government of India. (2017, July 1). Tele-Law: Connecting India's Villages to Legal Aid.
National Legal Services Authority, Government of India. (2019, July 1). Annual Report 2019-20.
OECD (2023, January 1). Digital transformation in the justice sector: Challenges and opportunities.
https://www.bing.com/videos/search?q=OECD.+(2023).+Digital+Transformation+in+the+Justice+Sector%3a+Challenges+and+Opportunities&qpvt=OECD.+(2023).+Digital+Transformation+in+the+Justice+Sector%3a+Challenges+and+Opportunities&FORM=VDRE
Srivastava, A., & Sharma, R. (2018). Tele-Law: Bridging the legal access gap in rural India. Journal of Rural Development, 37(4), 623–640.
UNODC (2022, January 1). The use of technology in justice systems in developing countries.
https://www.unodc.org/rosaf/stories/2022/July/unodc-joins-top-ranking-representatives-of-key-criminal-justice-institutions-in-mozambique-to-discuss-the-use-and-abuse-of-technology-in-mozambique-on-world-day-against-trafficking-in-persons.html
World Bank. (2021). Digital government: Leveraging technology for better governance.
Yadav, K., & Chopra, D. (2021). Evaluating the impact of Tele-Law on marginalized communities in India. Social Change, 51(2), 275–292.
Page 1 of
Download Count : 83
Visit Count : 178
Keywords
Information & Communication Technology (ICT); Tele-Law; Legal Assistance; Community Service Centers (CSCs)
Author(s) Information

How to cite this article
Mummalaneni, V., & Challa, C. (2024). Tele-Law: Bridging the legal access gap for marginalized communities in rural India using ICT. European Journal of Studies in Management and Business, 32, 1-27. https://doi.org/10.32038/mbrq.2024.32.01
Acknowledgments
Not applicable.
Funding
Not applicable.
Conflict of Interests
No, there are no conflicting interests.
Open Access
This article is licensed under a Creative Commons Attribution 4.0 International License, which permits use, sharing, adaptation, distribution and reproduction in any medium or format, as long as you give appropriate credit to the original author(s) and the source, provide a link to the Creative Commons license, and indicate if changes were made. You may view a copy of Creative Commons Attribution 4.0 International License here: http://creativecommons.org/licenses/by/4.0/