


Original Research
FinTech Firms Dividend Payout Policy: Evidence from Covid-19
- Abstract
- Full text
- Metrics
The breakthrough of the Covid-19 pandemic has not only caused significant disruption across numerous industries globally but also marked a surge in digital transformation within the financial sector through the adoption of FinTech. The pandemic was exceptional for the FinTech sector as it developed and accelerated the adoption of FinTech firms. This study examines the impact of Covid-19 on FinTech firms’ dividend policy by applying logistic regression models. The sample includes 171 FinTech firms listed in The STOXX Global FinTech Index from 2014 to 2021. The findings reveal that FinTech firms tend to increase or maintain their dividend payments rather than omit them during Covid-19 to convey positive signals to the market.
FinTech Firms Dividend Payout Policy:
Evidence from Covid-19
Salma Ali, Heba Ali , Amira Tarek*
German University in Cairo, Egypt
Abstract:
The breakthrough of the Covid-19 pandemic has not only caused significant disruption across numerous industries globally but also marked a surge in digital transformation within the financial sector through the adoption of FinTech. The pandemic was exceptional for the FinTech sector as it developed and accelerated the adoption of FinTech firms. This study examines the impact of Covid-19 on FinTech firms’ dividend policy by applying logistic regression models. The sample includes 171 FinTech firms listed in The STOXX Global FinTech Index from 2014 to 2021. The findings reveal that FinTech firms tend to increase or maintain their dividend payments rather than omit them during Covid-19 to convey positive signals to the market.
The emergence and adoption of Financial Technology, or FinTech, has been a noteworthy development in the financial industry over the past few decades. FinTech represents the convergence of finance and technology to transform the way financial services are accessed and delivered, including a wide range of innovative financial services and products facilitated by digitization. FinTech represents a paradigm shift in the financial industry, reshaping how individuals, businesses, and institutions interact with money and financial services. It offers a broad range of innovations, from mobile payment apps and peer-to-peer lending platforms to robo-advisors and blockchain-based solutions (Giglio, 2022). The roots of FinTech can be traced back to the financial crisis of 2008, which exposed some weaknesses and inefficiencies in traditional financial institutions and pushed consumers to look elsewhere as the assumption that traditional institutions were risk-free shattered. In the aftermath of this crisis, FinTech solutions gained traction as they aimed to address these shortcomings and innovate the financial sector (Gai et al., 2018). FinTech companies operate across diverse areas of finance, including banking, insurance, investing, asset management, lending, and payments. They aim to increase efficiency, lower costs, enhance decision-making and risk assessment, and provide more convenient, accessible, transparent, and personalized services than incumbent financial firms (Anifa et al., 2022; Gromek, 2018).
On the one hand, the technological evolution of financial services entails modifications to business models and services that were previously provided and are now organized on multi-sided digital platforms. Technology continues to play a vital part in the delivery of financial services, and FinTech firms take a more different and detrimental approach with a customer-centric focus. FinTech firms are expected to create profit and value for the financial sector as a whole through competition and creativity. Nevertheless, numerous of these firms face difficulty not only to be profitable but also to endure (Carbó-Valverde et al., 2022). Global statistics show that the global FinTech investment climbed from $9.28 billion in 2008 to $168 billion in 2018. Surprisingly, over half of the world's top 100 leading FinTech cities are in emerging markets, and this shows the increasing importance of FinTech firms over the years in both developed and emerging markets (Safiullah & Paramati, 2022). According to CB Insights State of Venture Report, 26 FinTech startups globally valued at $83.8 billion got $17.4 billion in investment in 2016 and were on track to exceed that figure by late 2017. Moreover, 39 VC (venture capital)-backed FinTech startups were valued at $147.37 billion by the end of 2018. As at the end of 2021, according to KPMG (2022), the total amount of investment income in the FinTech sector amounted to USD 210.1 billion, which is 31.79% more than in 2020, and it was only 51.2 billion USD in 2014. In addition, the number of investment agreements has increased from 1,628 in 2014 to 3,764 in 2021.
The Covid-19 pandemic has had a significant and unparalleled influence on global equity markets, investment funds, and commodity markets (Díaz et al., 2021; Rubbaniy et al., 2022). While the global pandemic Covid-19 has caused unprecedented transformations in our daily lives, work routines, and social interaction, and within a few months, it has expanded from a regional health crisis in China to a major shock to the global economy (Yoo et al., 2021), FinTech has emerged as a critical player in this context, with innovative digital tools and services that enable individuals and businesses to rapidly switch from physical to remote working practices, while remaining as efficient as possible (Van et al., 2020). In response to Covid-19 implications, companies have to change their financing and investment decisions, including dividend payout decisions. The choice of dividend policy is crucial for businesses because it directly affects both their investment and financing choices (Pinto, 2020). If a company decides not to pay or pays fewer dividends, it will have more internal earnings, which reduces its reliance on external earnings. On the contrary, if a company pays high dividends, it will have less internal earnings, which increases its reliance on debt or other external financing. This implies that the decision to raise funds is directly linked to the dividend policy. As a direct consequence, dividend policy influences a company's investment decisions and cost of capital because it influences the firm's capital structure (Yusof & Ismail, 2016). Moreover, the previous literature highlights that dividends have a significant effect on a company's stock price or market value. For instance, Anderson and Reeb (2003) find that dividend-paying companies have higher abnormal returns than companies that do not pay dividends. In accordance with the findings revealed by Seida (2001), dividend announcements are accompanied by positive abnormal returns.
Although a growing number of studies are being conducted to investigate the empirical impact of Covid-19 on financial markets (Al-Awadhi et al., 2020), the dividend policy decision of firms is still controversial whether firms tend to increase, decrease, or omit dividend during the pandemic. Accordingly, this paper aims to examine the dividend policy of FinTech firms, whether they tend to increase, decrease, or maintain their policies unchanged during the pandemic through the use of a Logit regression model. We seek to contribute to the literature in several ways. First, our results help get more insights into FinTech firms’ corporate policies, which remains an underexplored subject in the literature. By doing so, this study extends not only the increasingly growing literature on dividend policies but also the literature that focuses on FinTech and its role in today’s world. Second, we provide novel findings on the nexus between Covid-19, dividend policies, and FinTech. To the best of our knowledge, this paper, as an original contribution, is the first to examine the corporate dividend policy of FinTech firms and also extends the extant literature on crises and downturns. It also enriches the ongoing discussion on the role of the financial sector in general and FinTech in specific in a post-pandemic world. Third, by examining firms included in the STOXX Global FinTech Index, we hope to make further contributions to the literature by extending the evidence on FinTech firms beyond the US or a single-country setting.
The remainder of this paper is organized as follows. Section 2 discusses the theoretical background and hypothesis development. Section 3 describes the dataset and the empirical methodology employed in the study. Section 4 reports and discusses the results of the empirical tests. Then, the final section concludes the findings of this study.
Theoretical Background and Hypothesis Development
In the context of Covid-19, there are severe funding shortages and numerous companies are struggling financially, which results in unprecedented financial pressure that obliges numerous companies to modify their day-to-day operations and change their financing and investing decisions, including dividend payout decisions (Didier et al., 2021; Meyer et al., 2022; Wang et al., 2020). As the economic devastation continued to escalate, companies worldwide reassessed their financial positions in light of both observed and expected revenue declines, leading them to opt for reducing or completely suspending their corporate dividends. Unsurprisingly, over 800 publicly traded companies in the United States announced reductions in or elimination of dividend payments in 2020 in order to reserve some cash (Krieger et al., 2021)
The Covid-19 pandemic has resulted in unprecedented financial pressure since many companies are in financial distress, and there are significant financing shortages, besides the regular maintenance costs and credit repayments that remain unaffected. Financial market risks and uncertainties have also increased worldwide (Al-Awadhi et al., 2020). Many companies’ cash reserves can only cover expenses for 1-3 months. Because of production disruption, there was significant uncertainty regarding companies' prospects and operating efficiency. Meanwhile, investor sentiment suffers significantly, as fear of a pandemic makes investors more pessimistic about the future and less willing to invest capital in companies, which in turn escalates financial pressure (Chen et al., 2020). In the context of Covid-19 and the “Stay-at-home economy,” economic activities have been reduced globally which has caused a negative impact on the firm financial intermediation and information asymmetry. As the degree of information asymmetry between banks and companies grows, banks resort to lending to manage risk. In addition, limiting bond issuance and equity financing results in increasing firms' financial constraints (Hu & Gong, 2019; Ling et al., 2021). As demonstrated by Goodell (2020) financial constraints on companies are tightened as a result of reduced financial flexibility and higher financial costs. Financial constraints are common issues in business processes that have an impact on firm growth, efficiency, and innovative investment, as they generally impact both short-term and long-term financing decisions of the firm (Chen et al., 2020).
In response to Covid-19, companies have to change their day-to-day operations in addition to changing their financing and investment decisions, including dividend payout decisions (Didier et al., 2021; Meyer et al., 2022; Wang et al., 2020). As economic devastation spread, companies worldwide reassessed their financial positions in light of both the observed and expected revenue declines. Emergency cash-saving measures were implemented quickly. In addition to the tens of millions of people affected by layoffs, corporate dividends have been entirely reduced or suspended. Dividend payments make companies have less internal earnings and increase their reliance on debt or other external financing, which becomes a difficult source to acquire given the circumstances of high financial constraints during the pandemic. Unsurprisingly, over 800 publicly traded companies in the United States announced reductions in or elimination of dividend payments by the end of August 2020 in order to reserve some cash (Krieger et al., 2021).
On the other hand, many factors could ease these corporate financial constraints, such as financial technology, which is the heart of FinTech firms. The breadth and depth of financial technology development help reduce the cost of debt financing and, therefore, ease corporate financial constraints. Many researchers have demonstrated the ability of FinTech to alleviate corporate constraints during Covid-19. According to Ling et al. (2021), Huang (2022), Cao et al. (2023), and Nie et al. (2023), FinTech has a mitigating impact on the negative consequences of Covid-19 on the financial constraints due to its dual role of reducing information asymmetry and the financial costs. Consequently, depending on external financing sources for FinTech firms that use these technologies is not difficult compared to other firms, which in turn is supposed to be reflected in their dividend policies.
Additionally, the previous literature extensively shows how FinTech eases corporate financing constraints by alleviating information asymmetry and providing alternative financing sources with relatively lower transaction costs (Gomber et al., 2018; Huang et al., 2019; Wang et al., 2021; Xue et al., 2022), simplifying financial business procedures and reducing the costs of credit approval, making the loan approval speed faster than traditional financial institutions (Fuster et al., 2019), and alleviating the debt default risk (Nie et al., 2023). Consequently, FinTech technology alleviates the financial constraints caused by the pandemic, which led firms to suspend their dividend payments in order to have more internal earnings and decrease their dependence on debt or external financing. However, adopting financial technologies in FinTech firms solves this problem, which should cause no decrease in dividend payments in these firms.
The impact of Covid-19 on corporate dividend policy in FinTech firms could be tackled from the perspectives of two theories: Signaling and Agency theories. According to the Signaling theory, FinTech firms may maintain or even increase dividend payments during a crisis to signal better performance to the market (Booth & Chang, 2011; Caton et al., 2003). Dividends can convey both negative and positive information to shareholders, which is why they are considered a signal to shareholders about the firm’s conditions because there is asymmetric information between management and shareholders (Robiyanto & Yunitaria, 2022). Asymmetric information is a condition under which shareholders are not given access to company policies, which can affect their performance. Ozo and Arun (2019) report that there is a significant abnormal return around the dividend announcement date, consistent with the prediction of Signaling theory. Generally, managers strive to avoid decreasing dividends since it has negative consequences, attempting to keep the dividend stream fairly constant, and they are hesitant to make changes that may have to be reversed (Baker et al., 2016).
On the other hand, the agency-based theories of corporate behavior state that senior executives are extremely hesitant to cut dividends in response to earnings declines in order to reduce their own employment risk and maintain their personal interests. This explains why FinTech firms’ managers may increase dividends even if earnings deteriorate because of Covid-19 (Lambrecht & Myers, 2012; Wu, 2018). David and Ginglinger (2016) investigate payout channel choices using the agency theory and notice that firms with large institutional investors are more willing to distribute dividends during a downturn in the economy in order to maintain market confidence. Furthermore, given the role of FinTech technology in alleviating financial constraints and reducing the cost of debt, even in crisis times like Covid-19. In addition to the willingness of FinTech firms to signal their resilience in their first economic shock to gain acceptance from the market and investors and to avoid the negative consequences of dividend omissions or cuts, FinTech firms are expected to have a greater ability to increase or maintain their dividends during Covid-19.
A limited number of recent studies have shed light on corporate dividend policy during the crisis and have concluded mixed results. The first stream of research concludes that firms tend to cut or omit dividend payments during Covid-19 in order to keep extra cash on hand and improve their resilience (Cejnek et al., 2021; Krieger et al., 2021). For instance, Hauser (2013) found that during the 2008 financial crisis, the probability of a dividend cut increased while the probability of paying a dividend decreased. In accordance with a similar study conducted by Krieger et al. (2021) in the context of Covid-19, out of 1400 dividend-paying firms, 213 companies decided to cut dividends, and 93 companies omitted dividends in 2020 entirely, which is three to five times higher than any other decline since 2015. Another stream of research argues that firms tend to increase or maintain their dividend payouts during covid-19 (Ali, 2022; Mazur et al., 2020). Likewise, the study conducted by Ali (2022) concludes that firms either maintained or increased dividends during the Covid-19 period to avoid a bad signal, which supports Signaling theory. Furthermore, given the role of FinTech technology in alleviating financial constraints and reducing the cost of debt, even in crisis times like Covid-19. In addition to the willingness of FinTech firms to signal their resilience in their first economic shock to gain acceptance from the market and investors and to avoid the negative consequences of dividend omissions or cuts, FinTech firms are expected to have a greater ability to increase or maintain their dividends during Covid-19. Based on the above discussion, the following hypothesis is formulated:
H1: FinTech firms would be associated with a higher probability of increasing or maintaining rather than decreasing their dividend payments during Covid-19
Method
Sample
The study sample includes 171 FinTech firms listed in The STOXX Global FinTech Index after dropping missing values over the period (2014–2021) with the aim of examining FinTech firm’s valuation before and during the Covid-19 pandemic period. Table 1, Panel A, reports the sample distribution across industries, showing that the financial services (44.44%) accounts for the largest proportion of the sample, Industrial Goods and Services (30.41%), and the technology industry represents 25.15% of the sample. Finally, Panel B demonstrates that the region of the Americas (Australia) has the largest (lowest) number of firms (51.46% and 4.67%, respectively).
Sample Distribution
|
Panel A: Sample Distribution by Industry |
||
|
Industry |
Freq. |
Percent |
|
Financial Services |
76 |
44.44 |
|
Industrial Goods and Services |
52 |
30.41 |
|
Technology |
43 |
25.15 |
|
Total |
171 |
100.00 |
|
Panel B: Sample Distribution by Region |
||
|
Region |
Freq. |
Percent |
|
Americas |
88 |
51.46 |
|
Asia |
52 |
30.05 |
|
Australia |
8 |
4.67 |
|
Europe and Africa |
23 |
13.45 |
|
Total |
171 |
100.00 |
Note. This table reports the sample summary statistics. Panel A reports the sample distribution by industry based on the STOXX Global FinTech Index, where freq. refers to the number of firms in each industry and percent refers to the percentage each industry represents in the thesis. Then, Panel B reports the sample distribution by region where freq. refers to the number of firms in each region and percent refers to the percentage each region represents in the thesis.
Variable Definition and Construction
In order to examine the change in dividend of FinTech firms during Covid-19, following, Nissim and Ziv (2001), Rangvid et al. (2014), and Ali (2022), annual data are collected from Thomson Reuters Eikon and used to account for the presence of potential seasonality in the dividend-growth patterns (Rangvid et al., 2014). Accordingly, at the beginning of each year , the dividend change rate is defined as the percentage difference between the dividends in year , and the previous year as shown in (Eq.1):
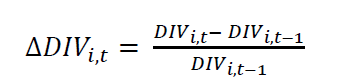 Eq.1
Eq.1
Following Hauser (2013) and Ali (2022), corporate dividend policy decisions during the pandemic period are explained through a binary dependent variable that indicates a firm’s decision regarding dividend changes. For example, for the dividend decrease versus increase decision, the binary dependent variable is a dummy variable equal to 1 if the firm increased the dividend and zero if it decreased. Thus, three binary dependent variables are used.
To capture the impact of Covid-19 on FinTech firms, a dummy variable is created to distinguish between the years before the pandemic era and the years during and after the pandemic. It takes the value of one for 2019, 2020, and 2021 and zero otherwise. Table 2 provides a range of well-documented control variables that are found to affect firms’ corporate dividend decisions.
Control Variables
|
Control Variable |
Measurement |
Reference |
|
Profitability |
Return on Assets (ROA) = Earnings, before interest and tax / Total Assets |
|
|
F-EPS-GR = 12-month forward EPS |
||
|
Firm Liquidity |
Cash % Total Assets = Total Cash / Total Assets |
|
|
F-Free Cashflows= 12-month forward cashflows |
||
|
Firm Size |
LnTA = The log value of Total Assets |
|
|
Leverage |
Debt Ratio = Total Debt / Total Assets |
|
|
Operating Performance |
Asset Turnover = Sales / book value of assets |
Note. This table summarizes the control variables that have been used in this paper and identified from Thomson Reuters Eikon.
Method
To assess the impact of Covid-19 on corporate dividend policies in FinTech firms, logit regression models are utilized. Our baseline models are as follows:
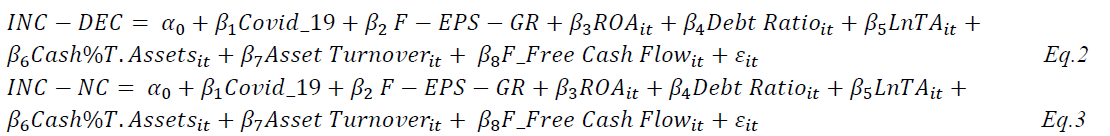

Where, in equation (2), INC_DEC is a dummy variable that takes the value of 1 for a firm’s decision to increase dividends and 0 if it decides to decrease dividend payments. In equation (3), INC-NC is a dummy variable that takes the value of 1 for a firm’s decision to increase dividends and 0 if there is no change in the dividend policy. In equation (4), DEC_NC is a dummy variable that takes the value of 1 if a firm decides to decrease dividends and 0 if there is no change in dividend policy.
Empirical Results
In this section, we get preliminary insights into FinTech firms’ dividend policy. Table 3 reports the descriptive statistics for the used variables. The first dummy variable (INC_DEC) has the highest mean compared to the other dependent variables, which means that, on average, the number of firms that tended to increase their dividend payments during the pandemic was greater than the number of firms that tended to decrease their dividends.
Table 3 presents the mean, standard deviation, minimum, and maximum of FinTech firms' dividend policy variables obtained from firm-year observations for the period (2014-2021). INC_DEC is a dummy variable that takes the value of one for a firm’s decision to increase dividends and zero if it decides to decrease dividend payments. INC-NC is a dummy variable that takes the value of 1 for a firm’s decision to increase dividends and 0 if there is no change in its dividend policy. DEC_NC is a dummy variable that takes the value of one if a firm decides to decrease dividends and zero if there is no change in its dividend policy. Covid-19 is a dummy variable that takes the value of one for the years 2019, 2020, and 2021 and zero for the years 2014, 2015, 2016, 2017, and 2018. ROA is the return on assets measured as earnings before interest and tax divided by total assets. F-EPS-Gr is a 12-month forward EPS. Debt Ratio is the leverage ratio, measured by dividing the total debt over the total assets. LnTA is the log value of Total Assets. Cash% Total Assets is measured as cash scaled by total assets. Asset Turnover is measured by dividing sales by the book value of the assets. F-free cashflow is a 12-month free cashflow.
Table 3
Descriptive Statistics for Corporate Dividend Policy
|
Variable |
M |
SD |
Min |
Max |
|
INC_DEC |
0.71 |
0.45 |
0 |
1 |
|
INC_NC |
0.40 |
0.49 |
0 |
1 |
|
DEC_NC |
0.20 |
0.40 |
0 |
1 |
|
ROA |
0.03 |
0.14 |
-1.68 |
0.60 |
|
F-EPS-Gr |
0.12 |
0.70 |
-10.60 |
7.09 |
|
Debt Ratio |
0.65 |
0.33 |
0.00 |
5.16 |
|
LnTA |
14.63 |
2.21 |
3.29 |
20.85 |
|
Cash % Total Assets |
0.19 |
0.20 |
0.00 |
0.99 |
|
Assets Turnover |
0.46 |
0.52 |
-0.04 |
5.96 |
|
F-free cashflow |
3.72 |
5.20 |
-9.71 |
50.68 |
For an overall assessment of firm dividend policies, Table 4 reports the yearly sample distribution of FinTech firms based on their dividend policies. The results show that the percentage of FinTech firms that tend to raise their dividend payments during Covid-19 is 40% compared to only 31% before the pandemic. On the other hand, the percentage of FinTech firms that tend to decrease their dividend payments during Covid-19 is 12% compared to only 15% before the pandemic.
This implies that FinTech firms tend to increase their dividend payments rather than decrease them, which provides a preliminary acceptance of H1. Moreover, these findings are consistent with those of Mazur et al. (2020) and Ali (2022), who argue that firms tend to increase or maintain their dividend payouts during Covid-19. However, these findings contrast those of Cejnek et al. (2021) and Krieger et al. (2021), who conclude that firms tend to cut or omit dividend payments during Covid-19 to keep extra cash on hand. Thus, FinTech firm managers prefer not to decrease dividend payments to reserve extra cash in such turbulent times to avoid the negative consequences of dividend omission and signal positive performance to the market.
Table 4 reports the yearly sample distribution of FinTech firms based on their dividend policies from 2014 to 2021 by dividing the whole sample into three sub-samples. Therefore, there are three sub-samples: FinTech firms that tend to increase their dividend payments (Dividend Increase), FinTech firms that decrease their dividend payments (Dividend Decrease), and FinTech firms that choose to maintain their dividend payments (No Change). Each sub-group includes two columns: the first one shows the number of FinTech firms each year, and the second column shows their percentage compared to the whole sample. Additionally, Table 4 highlights the average number of firms that increased, decreased, or kept their dividend payments before and during the Covid-19 pandemic.
Yearly Sample Distribution of Firm Dividend Policies (N=171)
|
Year |
Dividend Increase |
Dividend Decrease |
No Change |
Total |
||
|
2014 |
43 |
25% |
28 |
16% |
100 |
58% |
|
2015 |
51 |
30% |
24 |
14% |
96 |
56% |
|
2016 |
49 |
29% |
30 |
18% |
92 |
54% |
|
2017 |
67 |
39% |
15 |
9% |
89 |
52% |
|
2018 |
56 |
33% |
28 |
16% |
87 |
51% |
|
Average before Covid-19 |
53.2 |
31% |
25 |
15% |
92.8 |
54% |
|
2019 |
67 |
39% |
24 |
14% |
80 |
47% |
|
2020 |
79 |
46% |
10 |
6% |
82 |
48% |
|
2021 |
61 |
36% |
28 |
16% |
82 |
48% |
|
Average during Covid-19 |
69 |
40% |
20.7 |
12% |
81.3 |
48% |
Table 5 provides preliminary statistics on the firm-specific characteristics across the three distinct groups during the Covid-19 pandemic in order to gain more insights into the characteristics of the different dividend change groups. Overall, dividend-increasing firms – compared to the other sub-samples – have better profitability and positive earnings prospects. For example, the ROA for the dividend increase sample is .07, compared to only .04 (-.02) for the dividend decrease (no-change) sample. This is consistent with Dewasiri et al. (2019) and Ali (2022), who found a positive relationship between firm profitability and dividend policy.
Furthermore, the dividend-increasing firms have, on average, a relatively larger size and a higher forward free cash flow. For instance, the forward free cash flow for the dividend increase sample is 4.35 compared to only 2.74 (3.42) for the dividend decrease (no-change) sample. These findings are consistent with Dewasiri et al. (2019), Rochmah and Ardianto (2020), and Brawn and Šević (2018) and prove that dividend-increasing firms tend to be fairly large, glamour, profitable, and operationally efficient. On the other hand, dividend-decreasing firms – compared to the other sub-samples – have higher leverage, negative forecasted EPS growth, and the least free cash flows. As supported by Cejnek et al. (2021), who conclude that firms with higher financial risk due to leverage are more likely to cease dividends. Finally, dividend-no-change firms have positive forecasted EPS growth, higher free cash flow, and better leverage positions compared to dividend-decreasing firms.
Table 5 reports FinTech firm characteristics by dividend change group. Panel A includes FinTech firms that increased their dividend payments during the Covid-19 pandemic. Panel B comprises FinTech firms that decided to decrease their dividend payments during Covid-19, and Panel C combines FinTech firms that kept their dividend policy unchanged during the pandemic. ROA is the return on assets measured as earnings before interest and taxes divided by total assets. F-EPS-Gr is a 12-month forward EPS. Debt Ratio is the leverage ratio, measured by dividing the total debt over the total assets. LnTA is the log value of Total Assets. Cash% Total Assets is measured as cash scaled by total assets. Asset Turnover is measured by dividing sales by the book value of the assets. F-free cashflow is a 12-month free cashflow.
Table 6 shows the correlation coefficients between all corporate dividend policy variables, Covid-19, and control variables. The first binary dependent variable (INC_DEC), which represents a FinTech firm’s tendency to increase or decrease its dividends, exhibits a significantly positive association with Covid-19, profitability, earnings prospects, size, asset turnover, and forward free cash flow, while it is negatively correlated with leverage and liquidity measured by the percentage of cash from the total assets. This means that FinTech firms tend to increase their dividend payments during the pandemic. In addition, it provides many insights into the firm characteristics that act as determinants of dividend policy since Table 6 shows that FinTech firms that increased their dividend payments during the pandemic have higher profitability, larger size, more earnings prospects, high assets turnover, more expected cash flow, and low leverage position.
The second variable (INC_NC), which represents a FinTech firm’s tendency to increase or maintain its dividend policy unchanged, exhibits a significantly negative association with Covid-19, forward free cash flow, and asset turnover while showing a positive association with the rest of the variables. This implies that FinTech firms tend to maintain their dividend payments unchanged during the pandemic. Additionally, the final variable (DEC_NC), which indicates a FinTech firm’s tendency to decrease dividends or keep its dividend policy unchanged, exhibits a significantly negative association with Covid-19, forward free cash flow, earnings prospects, and assets turnover while showing a positive association with the rest of the variables. This means that FinTech firms tend to maintain their dividend payments unchanged during the pandemic if the other option is to decrease them. Therefore, these results provide an overall direction for FinTech firms’ dividend policies during the pandemic.
Firm Characteristics of Firms by Dividend-change Group
|
Panel A: Dividend Increases Sample |
||||
|
|
M |
SD |
Min |
Max |
|
ROA |
0.07 |
0.08 |
-0.016 |
0.37 |
|
F-EPS-Gr |
0.15 |
0.25 |
-1.81 |
1.78 |
|
Debt Ratio |
0.65 |
0.25 |
0.02 |
1.20 |
|
LnTA |
15.47 |
2.00 |
10.89 |
20.85 |
|
Cash % Total Assets |
0.18 |
0.19 |
0.00 |
0.99 |
|
Assets Turnover |
0.42 |
0.46 |
0.00 |
5.43 |
|
F-free cashflow |
4.35 |
4.03 |
0.01 |
27.58 |
|
Panel B: Dividend Decreases Sample |
||||
|
ROA |
0.04 |
0.07 |
-0.39 |
0.34 |
|
F-EPS-Gr |
-0.04 |
0.93 |
-10.60 |
1.80 |
|
Debt Ratio |
0.69 |
0.24 |
0.12 |
1.35 |
|
LnTA |
15.15 |
2.04 |
10.94 |
20.38 |
|
Cash % Total Assets |
0.20 |
0.22 |
0.00 |
0.99 |
|
Assets Turnover |
0.41 |
0.66 |
-0.04 |
5.96 |
|
F-free cashflow |
2.74 |
3.95 |
0.00 |
19.57 |
|
Panel C: Dividend No-changes Sample |
||||
|
ROA |
-0.02 |
0.18 |
-1.68 |
0.60 |
|
F-EPS-Gr |
0.16 |
0.91 |
-4.60 |
7.09 |
|
Debt Ratio |
0.63 |
0.41 |
0.00 |
5.16 |
|
LnTA |
13.79 |
2.12 |
3.29 |
18.50 |
|
Cash % Total Assets |
0.20 |
0.20 |
0.00 |
0.99 |
|
Assets Turnover |
0.51 |
0.51 |
0.00 |
3.87 |
|
F-free cashflow |
3.42 |
6.16 |
-9.71 |
50.68 |
To test H1, we examine the impact of the Covid-19 pandemic on FinTech s firms' dividend policies. Table 6 illustrates the regression coefficients for the regression models estimated in Equations 2, 3, and 4. The findings reported in Model (I) demonstrate that Covid-19 has a positive and statistically significant coefficient on FinTech firms' decision to increase their dividends rather than decrease them during the pandemic and try to signal better performance and positive information to the market. On the other hand, Model (II) and (III) demonstrate that Covid-19 has a negative statistically significant coefficient on FinTech firms' decision to increase or decrease their dividends rather than not change them. Models I-III exhibit satisfactory explanatory power, reflected in R2, ranging from 27% to 59.9%.
These results are consistent with those of Mazur et al. (2020) and Ali (2022), who find that firms tend to increase or maintain their dividend payments during Covid-19. Ali (2022) mentioned that firms either maintain or increase their dividend policies during the Covid-19 period to avoid signaling negative signs about their conditions and performance. This explains why FinTech firms tend to have higher or unchanged dividend policies after the pandemic, which supports H1. Theoretically, these findings conclude that FinTech firms’ managers are reluctant to decrease their dividends during the pandemic, either to avoid signaling negative news about the firms to the market, as proposed by the signaling theory or to maintain their personal benefits, as proposed by agency theories (Booth & Chang 2011; Caton et al., 2003; Lambrecht & Myers, 2012; Wu, 2018).
These findings also show that firm profitability measured by ROA and firm size have positive and significant coefficient. However, the debt ratio and forward EPS have negative and significant coefficients. These results imply that firms with higher values for these characteristics (profitability and size) and low debt ratios tend to increase their dividends rather than decrease their dividend policy. In addition, Forward EPS has a negative and significant coefficient, implying that FinTech firms with high forward EPS tend to maintain dividends unchanged instead of decreasing dividend payments. These results are consistent with the findings of previous studies, including Ali (2022) and Dewasiri et al. (2019), who found a positive relationship between a firm’s profitability and dividend policy. However, firms with higher financial risk due to leverage are more likely to cease dividends, as supported by Cejnek et al. (2021), who note that leverage and the decline in dividends are both positively correlated.
Correlation of Corporate Dividend Policy
|
Covid-19 |
ROA |
F-EPS-GR |
Debt Ratio |
LnTA |
Cash% Total Assets |
Assets Turnover |
F-free cashflow |
|
|
Covid-19 |
1 |
|||||||
|
ROA |
-.09 |
1 |
||||||
|
F-EPS-GR |
.04 |
.11 |
1 |
|||||
|
Debt Ratio |
.00 |
-.22 |
.07 |
1 |
||||
|
LnTA |
.10 |
-.03 |
.10 |
.39 |
1 |
|||
|
Cash% Total Assets |
.06 |
.09 |
.04 |
-.01 |
-.32 |
1 |
||
|
Assets Turnover |
-.12 |
.35 |
.01 |
-.21 |
-.40 |
.15 |
1 |
|
|
F-free cashflow |
.09 |
.13 |
.00 |
.19 |
.31 |
-.04 |
-.03 |
1 |
|
INC_DEC |
.09 |
.17 |
.10 |
-.10 |
.11 |
-.06 |
.06 |
.16 |
|
INC_NC |
-.06 |
.29 |
.00 |
.03 |
.33 |
-.04 |
-.04 |
.08 |
|
DEC_NC |
-.13 |
.29 |
-.01 |
.14 |
.15 |
.02 |
-.10 |
-.06 |
Table 6 reports the correlations between the corporate dividend policy variables. INC_DEC is a dummy variable that takes the value of one for a firm’s decision to increase dividends and zero if it decides to decrease dividend payments. INC-NC is a dummy variable that takes the value of 1 for a firm’s decision to increase dividends and 0 if there is no change in its dividend policy. DEC_NC is a dummy variable that takes the value of one if a firm decides to decrease dividends and zero if there is no change in its dividend policy. Covid-19 is a dummy variable that takes the value of one for the years 2019, 2020, and 2021 and zero for the years 2014, 2015, 2016, 2017, and 2018. ROA is the return on assets measured as earnings before interest and tax divided by total assets. F-EPS-Gr is a 12-month forward EPS. Debt Ratio is the leverage ratio, measured by dividing the total debt over the total assets. LnTA is the log value of Total Assets. Cash% Total Assets is measured as cash scaled by total assets. Asset Turnover is measured by dividing sales by the book value of the assets. F-free cashflow is a 12-month free cashflow.
Table 7 shows the logit analysis of FinTech firms' dividend policies during the Covid-19 pandemic. Model (I) represents a FinTech firm’s tendency to increase or decrease its dividends, Model (II) indicates a FinTech firm’s tendency to increase or maintain its dividend policy unchanged, and Model (III) exhibits a FinTech firm’s tendency to decrease dividends or keep its dividend policy unchanged. Covid-19 is a dummy variable that takes the value of one for the years 2019, 2020, and 2021; and zero for the years 2014, 2015, 2016, 2017, and 2018. ROA is the return on assets measured as earnings before interest and tax divided by total assets. F-EPS-Gr is a 12-month forward EPS. Debt Ratio is the leverage ratio, measured by dividing the total debt over the total assets. LnTA is the log value of Total Assets. Cash% Total Assets is measured as cash scaled by total assets. Asset Turnover is measured by dividing sales by the book value of the assets. F-free cashflow is a 12-month free cashflow.
Logit Analysis for Corporate Dividend Policy
|
|
Model (I): INC_DEC |
Model (II): INC_NC |
Model (III): DEC_NC |
|
Covid-19 |
0.80* |
-0.74** |
-1.16* |
|
|
(1.87) |
(-2.07) |
(-1.77) |
|
F-EPS-GR |
0.09 |
-1.21*** |
-1.15* |
|
|
(0.11) |
(-3.61) |
(-1.73) |
|
ROA |
15.23*** |
36.98*** |
20.91** |
|
|
(2.96) |
(7.43) |
(2.43) |
|
Debt Ratio |
-2.35* |
0.28 |
7.24*** |
|
|
(-1.92) |
(0.31) |
(3.61) |
|
LnTA |
0.63*** |
1.28*** |
0.87*** |
|
|
(2.58) |
(6.31) |
(2.93) |
|
Cash % Total Assets |
0.03 |
0.01 |
-0.03 |
|
|
(1.49) |
(1.08) |
(-1.15) |
|
Assets Turnover |
0.03 |
-0.87 |
-0.70 |
|
|
(0.04) |
(-1.05) |
(-0.42) |
|
F-Free Cashflow |
-0.09* |
-0.05 |
0.02 |
|
|
(-1.73) |
(-1.45) |
(0.39) |
|
Constant |
-9.78** |
-19.27*** |
-16.61*** |
|
|
(-2.48) |
(-6.19) |
(-3.45) |
|
Country Effect |
Yes |
Yes |
Yes |
|
Observations |
238 |
371 |
246 |
|
Pseudo R2 |
0.27 |
0.52 |
0.59 |
Note. The asterisks ***, **, and * indicate significance at 1%, 5%, and 10%, respectively.
Summary and Conclusion
This paper examines the influence of Covid-19 on FinTech firms’ dividend policy. Three binary dependent variables are used to decide whether they tend to increase, decrease, or maintain their dividend policy unchanged, following Hauser (2013) and Ali (2022). The first one is INC_DEC, which takes a value of one if FinTech firms tend to increase their dividend payments and zero if they decrease them. The second binary dependent variable is INC_NC, which takes a value of one if FinTech firms increase their dividend payments and zero if they decide to maintain their dividend policy without any change, either decrease or increase. The final binary dependent variable is DEC_NC, which takes a value of one if FinTech firms decide to decrease their dividend payments and zero if they decide to maintain their dividend policy without changes. The thesis’s sample includes all FinTech firms listed in The STOXX Global FinTech Index, which comprises companies associated with financial technology (FinTech) over the period (2014–2021). The final sample includes 171 companies across three regions.
The findings reveal that Covid-19 has a positive statistically significant coefficient on FinTech firms’ decision to increase their dividend payments over decreasing them. However, the pandemic has a negative statistically significant coefficient on FinTech firms’ decision to increase or decrease over no change dividends. This means that FinTech firms tend to increase or maintain their dividend payments during the Covid-19 pandemic and try to avoid decreasing them to signal better performance and positive information to the market. Overall, these findings support H1 and are in accordance with the predictions of the signalling and agency theories. This means that FinTech firms’ managers are reluctant to decrease their dividends during the pandemic either to avoid signalling negative news about the firms to the market, as proposed by the signalling theory, or to maintain their personal benefits, as proposed by agency theories (Booth & Chang 2011; Lambrecht & Myers, 2012; Wu, 2018).
Moreover, the findings of this paper conclude that FinTech firms tend to increase or maintain their dividend policy during the pandemic, which characterizes FinTech firms as a preferred investment option for income-focused portfolios or investors who prefer dividend pay. Thus, corporate executives are advised to increase their investment in and implementation of such technologies to strengthen corporate financial performance during challenging times.
References
Al-Awadhi, A. M., Alsaifi, K., Al-Awadhi, A., & Alhammadi, S. (2020). Death and contagious infectious diseases: Impact of the COVID-19 virus on stock market returns. Journal of Behavioral and Experimental Finance, 27, 100–326. https://doi.org/10.1016%2Fj.jbef.2020.100326
Ali, H. (2022). Corporate dividend policy in the time of COVID-19: Evidence from the G-12 countries. Finance Research Letters, 46, 102–493. https://doi.org/10.1016/j.frl.2021.102493
Anderson, R. C., & Reeb, D. M. (2003). Founding‐family ownership and firm performance: evidence from the S&P 500. The Journal of Finance, 58(3), 1301–1328. http://dx.doi.org/10.1111/1540-6261.00567
Anifa, M., Ramakrishnan, S., Joghee, S., Kabiraj, S., & Bishnoi, M. M. (2022). FinTech innovations in the financial service industry. Journal of Risk and Financial Management, 15(7), 287.
Aydoğmuş, M., Gülay, G., & Ergun, K. (2022). Impact of ESG performance on firm value and profitability. Borsa Istanbul Review, 22(2), S119–S127. http://dx.doi.org/10.1016/j.bir.2022.11.006
Baker, M., Mendel, B., & Wurgler, J. (2016). Dividends as reference points: A behavioral signaling approach. The Review of Financial Studies, 29(3), 697–738. https://doi.org/10.1093/rfs/hhv058
Booth, L., & Chang, B. (2011). Information asymmetry, dividend status, and SEO announcement‐day returns. Journal of Financial Research, 34(1), 155–177. https://doi.org/10.1111/j.1475-6803.2010.01287.x
Brawn, D. A., & Šević, A. (2018). Firm size matters: Industry sector, firm age and volatility do too in determining which publicly-listed US firms pay a dividend. International Review of Financial Analysis, 58, 132–152. https://doi.org/10.1016/j.irfa.2018.05.002
Cao, Y., Chen, Z., Lu, M., Xu, Z., & Zhang, Y. (2023). Does FinTech constrain corporate misbehavior? Evidence from research and development manipulation. Emerging Markets Finance and Trade, 59(10), 3129–3151. http://doi.org/10.1080/1540496X.2023.2206518
Carbó-Valverde, S., Cuadros-Solas, P. J., & Rodríguez-Fernández, F. (2022). Entrepreneurial, institutional and financial strategies for FinTech profitability. Financial Innovation, 8(1), 1–36. http://doi.org/10.1186/s40854-021-00325-2
Caton, G. L., Goh, J., & Kohers, N. (2003). Dividend omissions and intraindustry information transfers. Journal of Financial Research, 26(1), 51–64. http://doi.org/10.1111/1475-6803.00044
Cejnek, G., Randl, O., & Zechner, J. (2021). The COVID-19 pandemic and corporate dividend policy. Journal of Financial and Quantitative Analysis, 56(7), 2389–2410. http://dx.doi.org/10.1017/S0022109021000533
Chen, Y., Shen, Y., & Wang, J. Y. (2020). Financial market reaction to dramatic public health shocks [translated from Chinese]. Journal of Financial Research, 6, 20–39.
David, T., & Ginglinger, E. (2016). When cutting dividends is not bad news: The case of optional stock dividends. Journal of Corporate Finance, 40, 174–191. https://doi.org/10.1016/j.jcorpfin.2016.07.008
Dewasiri, N. J., Yatiwelle Koralalage, W. B., Abdul Azeez, A., Jayarathne, P. G. S. A., Kuruppuarachchi, D., & Weerasinghe, V. A. (2019). Determinants of dividend policy: evidence from an emerging and developing market. Managerial Finance, 45(3), 413–429. http://dx.doi.org/10.1108/MF-09-2017-0331
Díaz, V., Ibrushi, D., & Zhao, J. (2021). Reconsidering systematic factors during the COVID19 pandemic–The rising importance of ESG. Finance Research Letters, 38, 101870. https://doi.org/10.1016/j.frl.2020.101870
Didier, T., Huneeus, F., Larrain, M., & Schmukler, S. L. (2021). Financing firms in hibernation during the COVID-19 pandemic. Journal of Financial Stability, 53, 100837.
Fuster, A., Plosser, M., Schnabl, P., & Vickery, J. (2019). The role of technology in mortgage lending. Review of Financial Studies, 32(5), 1854–1899. https://doi.org/10.1093/rfs/hhz018
Gai, K., Qiu, M., & Sun, X. (2018). A survey on FinTech. Journal of Network and Computer Applications, 103, 262–273. https://doi.org/10.1016/j.jnca.2017.10.011
Giglio, F. (2022). FinTech: A literature review. International Business Research, 15(1), 80–85. http://dx.doi.org/10.35808/ersj/2254
Gomber, P., Kauffman, R. J., Parker, C., & Weber, B. W. (2018). On the FinTech revolution: Interpreting the forces of innovation, disruption, and transformation in financial services. Journal of Management Information Systems, 35(1), 220–265. http://dx.doi.org/10.1080/07421222.2018.1440766
Goodell, J. W. (2020). COVID-19 and finance: Agendas for future research. Finance Research Letters, 35, 101512. https://doi.org/10.1016/j.frl.2020.101512
Gromek, M. (2018). Clarifying the blurry lines of FinTech: Opening the Pandora’s box of FinTech categorization. In T. Lynn, J. G. Mooney, P. Rosati, & M. G. Cummins (Eds.), The rise and development of FinTech (pp. 168-189). Routledge
Hauser, R. (2013). Did dividend policy change during the financial crisis? Managerial Finance, 39(6), 584–606. http://dx.doi.org/10.1108/03074351311322861
Hu, S., & Gong, D. (2019). Economic policy uncertainty, prudential regulation and bank lending. Finance Research Letters, 29, 373–378. https://doi.org/10.1016/j.frl.2018.09.004
Huang, S. (2022). Does FinTech improve the investment efficiency of enterprises? Evidence from China’s small and medium-sized enterprises. Economic Analysis and Policy, 74, 571–586. https://doi.org/10.1016/j.eap.2022.03.014
Huang, Z., Liao, G., & Li, Z. (2019). Loaning scale and government subsidy for promoting green innovation. Technological Forecasting and Social Change, 144, 148–156. https://doi.org/10.1016/j.techfore.2019.04.023
Kadioglu, E., & Yilmaz, E. A. (2017). Is the free cash flow hypothesis valid in Turkey? Borsa Istanbul Review, 17(2), 111–116. https://doi.org/10.1016/j.bir.2016.12.001
KPMG (2022). Pulse of FinTech H2’21. https://assets.kpmg.com/content/dam/kpmg/sg/pdf/2022/09/pulse-of-FinTech-h1-22-updated.pdf
Krieger, K., Mauck, N., & Pruitt, S. W. (2021). The impact of the COVID-19 pandemic on dividends. Finance Research Letters, 42, 101910. http://dx.doi.org/10.1016/j.frl.2020.101910
Lambrecht, B. M., & Myers, S. C. (2012). A Lintner model of payout and managerial rents. The Journal of Finance, 67(5), 1761–1810. https://doi.org/10.1111/j.1540-6261.2012.01772.x
Ling, S., Pei, T., Li, Z., & Zhang, Z. (2021). Impact of COVID-19 on financial constraints and the moderating effect of financial technology. Emerging Markets Finance and Trade, 57(6), 1675–1688. https://doi.org/10.1080/1540496X.2021.1904883
Mazur, M., Dang, M., & Vo, T. A. T. (2020). Dividend policy and the COVID-19 crisis. MPRA Paper. https://mpra.ub.uni-muenchen.de/id/eprint/108765
Meyer, B. H., Prescott, B., & Sheng, X. S. (2022). The impact of the COVID-19 pandemic on business expectations. International Journal of Forecasting, 38(2), 529–544. https://doi.org/10.1016/j.ijforecast.2021.02.009
Moalla, M., & Dammak, S. (2023). Corporate ESG performance as good insurance in times of crisis: lessons from US stock market during COVID-19 pandemic. Journal of Global Responsibility, 14(4), 381–402. https://doi.org/10.1108/JGR-07-2022-0061
Nie, Z., Ling, X., & Chen, M. (2023). The power of technology: FinTech and corporate debt default risk in China. Pacific-Basin Finance Journal, 78, 101969. https://doi.org/10.1016/j.pacfin.2023.101969
Nissim, D., & Ziv, A. (2001). Dividend changes and future profitability. The Journal of Finance, 56(6), 2111–2133. https://doi.org/10.1111/0022-1082.00400
Ozo, F. K., & Arun, T. G. (2019). Stock market reaction to cash dividends: evidence from the Nigerian stock market. Managerial Finance, 45(3), 366–380. http://dx.doi.org/10.1108/MF-09-2017-0351
Pinto, G., Rastogi, S., Kadam, S., & Sharma, A. (2020). Bibliometric study on dividend policy. Qualitative Research in Financial Markets, 12(1), 72–95. https://doi.org/10.1108/QRFM-11-2018-0118
Rangvid, J., Schmeling, M., & Schrimpf, A. (2014). Dividend predictability around the world. Journal of Financial and Quantitative Analysis, 49(5-6), 1255–1277.
Robiyanto, R., & Yunitaria, F. (2022). Dividend announcement effect analysis before and during the COVID-19 pandemic in the Indonesia Stock Exchange. SN Business & Economics, 2(2), 20. https://doi.org/10.1007/s43546-021-00198-8
Rochmah, H. N., & Ardianto, A. (2020). Catering dividend: Dividend premium and free cash flow on dividend policy. Cogent Business & Management, 7(1), 1812927. https://doi.org/10.1080/23311975.2020.1812927
Rubbaniy, G., Khalid, A. A., Rizwan, M. F., & Ali, S. (2022). Are ESG stocks safe-haven during COVID-19? Studies in Economics and Finance, 39(2), 239–255. https://doi.org/10.1108/SEF-08-2021-0320
Safiullah, M., & Paramati, S. R. (2022). The impact of FinTech firms on bank financial stability. Electronic Commerce Research, 24, 453–475. https://doi.org/10.1007/s10660-022-09595-z
Seida, J. A. (2001). Evidence of tax‐clientele‐related trading following dividend increases. Journal of the American Taxation Association, 23(s-1), 1–21. http://dx.doi.org/10.2308/jata.2001.23.s-1.1
Van, N. T. T., Vrana, V., Duy, N. T., Minh, D. X. H., Dzung, P. T., Mondal, S. R., & Das, S. (2020). The role of human-machine interactive devices for postCOVID-19 innovative sustainable tourism in Ho Chi Minh City Vietnam. Sustainability, 12(22), 9523. https://doi.org/10.3390/su12229523
Wang, Y., Hong, A., Li, X., & Gao, J. (2020). Marketing innovations during a global crisis: A study of China firms’ response to COVID-19. Journal of Business Research, 116, 214–220. https://doi.org/10.1016/j.jbusres.2020.05.029
Wang, Y., Xiuping, S., & Zhang, Q. (2021). Can FinTech improve the efficiency of commercial banks? —An analysis based on big data. Research in International Business and Finance, 55(35), 101338. http://dx.doi.org/10.1016/j.ribaf.2020.101338
Wu, Y. (2018). What’s behind smooth dividends? Evidence from structural estimation. The Review of Financial Studies, 31(10), 3979–4016. https://www.jstor.org/stable/48616782
Xue, Q., Bai, C., & Xiao, W. (2022). FinTech and corporate green technology innovation: Impacts and mechanisms. Managerial and Decision Economics, 43(8), 3898–3914. https://doi.org/10.1002/mde.3636
Yaacob, S. F., Rahman, A. A., & Karim, Z. A. (2016). The determinants of liquidity risk: A panel study of Islamic banks in Malaysia. Journal of Contemporary Issues and Thought, 6, 73–82. https://ejournal.upsi.edu.my/index.php/JCIT/article/view/1073
Yoo, S., Keeley, A. R., & Managi, S. (2021). Does sustainability activities performance matter during financial crises? Investigating the case of COVID-19. Energy policy, 155, 112330. https://doi.org/10.1016/j.enpol.2021.112330
Yung, K., & Root, A. (2019). Policy uncertainty and earnings management: International evidence. Journal of Business Research, 100, 255–267. https://doi.org/10.1016/j.jbusres.2019.03.058
Yusof, Y., & Ismail, S. (2016). Determinants of dividend policy of public listed companies in Malaysia. Review of International Business and Strategy, 26(1), 88–99. https://doi.org/10.1108/RIBS-02-2014-0030
Zheng, M. (2022). Is cash the panacea of the COVID-19 pandemic: Evidence from corporate performance. Finance Research Letters, 45, 102151. http://dx.doi.org/10.1016/j.frl.2021.102151
Page 1 of
Download Count : 50
Visit Count : 134
Keywords
Covid-19; FinTech Firms; Dividend Policy
Author(s) Information

How to cite this article:
Ali, S., Ali, H., & Tarek, A, (2024). FinTech firms dividend payout policy: evidence from Covid-19. European Journal of Studies in Management and Business, 31, 31-47. https://doi.org/10.32038/mbrq.2024.31.03
Acknowledgments
Not applicable.
Funding
Not applicable.
Conflict of Interests
No, there are no conflicting interests.
Open Access
This article is licensed under a Creative Commons Attribution 4.0 International License, which permits use, sharing, adaptation, distribution and reproduction in any medium or format, as long as you give appropriate credit to the original author(s) and the source, provide a link to the Creative Commons license, and indicate if changes were made. You may view a copy of Creative Commons Attribution 4.0 International License here: http://creativecommons.org/licenses/by/4.0/