


Original Research
Embedding Countries Governance in Assessing Companies' Sustainable Development Goals (SDGs) Reporting: A Quantitative Analysis
- Abstract
- Full text
- Metrics
The United Nations Sustainable Development Summit in New York in September 2015 resulted in a tumultuous period for the companies in their quest to support the 17 Sustainable Development Goals (SDGs). The adoption of SDGs by all United Nations member states targets ending poverty and other deprivations, developing strategies to improve health and education, reducing inequality, and spurring economic growth while tackling climate change and working to preserve oceans and forests. This paper aims to assess the influence of countries' governance six dimensions (Voice and Accountability, Political Stability and Absence of Violence/Terrorism, Government Effectiveness, Regulatory Quality, Rule of Law, and Control of Corruption) on European companies' Sustainable Development Goals (SDGs) reporting from 2019 to 2021. To achieve this goal, quantitative research was conducted through linear parametric regressions. The econometric analysis is based on six regression equations, one for each countries' governance dimension, data being collected from Thomson Reuters, World Bank Governance Indicator, and International Monetary Fund databases. The sample includes 2542 companies headquartered in Europe, with 6644 panel data observations highlighted. The results show that the indicators regarding countries’ governance negatively influence companies' SDGs reporting. This study fills the gap in countries' governance research in relation to companies' SDGs reporting, which helps develop future research. Therefore, future research should address other methods of quantifying the score of companies' SDGs reporting. Furthermore, this research may be extended to all 193 United Nations member states to investigate the impact of SDGs reporting on country performance.
Embedding Countries Governance in Assessing Companies' Sustainable Development Goals (SDGs) Reporting: A Quantitative Analysis
Emil Adrian Bancu, Cornelia Dascalu |
1Doctoral School of Accounting, Bucharest University of Economic Studies, Bucharest, Romania 2Department of Accounting and Audit, Bucharest University of Economic Studies, Bucharest, Romania |
| ABSTRACT |
The United Nations Sustainable Development Summit in New York in September 2015 resulted in a tumultuous period for the companies in their quest to support the 17 Sustainable Development Goals (SDGs). The adoption of SDGs by all United Nations member states targets ending poverty and other deprivations, developing strategies to improve health and education, reducing inequality, and spurring economic growth while tackling climate change and working to preserve oceans and forests. This paper aims to assess the influence of countries' governance six dimensions (Voice and Accountability, Political Stability and Absence of Violence/Terrorism, Government Effectiveness, Regulatory Quality, Rule of Law, and Control of Corruption) on European companies' Sustainable Development Goals (SDGs) reporting from 2019 to 2021. To achieve this goal, quantitative research was conducted through linear parametric regressions. The econometric analysis is based on six regression equations, one for each countries' governance dimension, data being collected from Thomson Reuters, World Bank Governance Indicator, and International Monetary Fund databases. The sample includes 2542 companies headquartered in Europe, with 6644 panel data observations highlighted. The results show that the indicators regarding countries’ governance negatively influence companies' SDGs reporting. This study fills the gap in countries' governance research in relation to companies' SDGs reporting, which helps develop future research. Therefore, future research should address other methods of quantifying the score of companies' SDGs reporting. Furthermore, this research may be extended to all 193 United Nations member states to investigate the impact of SDGs reporting on country performance. |
| KEYWORDS: Sustainable Development Goals (SDGs), Countries Governance, Companies, Sustainability, Econometric Analysis |
Introduction
Companies’ sustainable development around the world has a continuous dynamic observed both in academic literature and in practice (Bose & Khan, 2022; Rosati & Faria, 2019a). The 2030 Agenda for Sustainable Development addresses challenges to a comprehensive array of goals, aiming at people, planet, prosperity, peace, and partnership, grouped into 17 SDGs. This led to the development of a new framework for reporting sustainability, in addition to CSR or ESG disclosure (Baldini et al., 2018; Coluccia et al., 2018; De Villiers & Marques, 2016). In different studies, all these authors examined countries' governance influence on sustainability disclosed and reported through CSR features and ESG indicators.
This study aims to analyze the influence of countries' governance on European companies' SDGs reporting. Quantitative research is applied based on a sample of 2542 companies with headquarters in European countries and covering the period 2019 - 2021. The findings reveal an average of around 56% of the overall SDGs reporting score, meaning that slightly more than half of European companies report SDGs items over 2019-2021. Moreover, this research provides evidence that the political stability and absence of violence, including terrorism, as well as regulatory quality and control of corruption, significantly influence European companies' overall SDGs reporting scores.
Adding to previous research, this study contributes by filling the gap of the scarce literature, proofing mixed results on the relationship between countries' governance dimensions and companies’ SDGs reporting. In this respect, an overall SDGs reporting score was developed to measure companies’ involvement in disclosing their SDGs actions in relation to country-level institutional factors.
This paper is structured as follows. After the Introduction, the literature review argues for research hypotheses development in Section 2. Next, Section 3 presents the sample, research variables, and baseline regression models, with the primary results of descriptive statistics and regression analysis discussed in Section 4. Finally, Section 5 concludes the study findings and outlines the research limitations for drawing future research directions.
Literature review
Over time, the trend of reporting non-financial information for sustainable development has been observed in academic literature and practice (Bose & Khan, 2022; Rosati & Faria, 2019a). The sustainability concept, claiming to achieve current needs without diminishing the ability of future generations to meet their own, has been adopted by governments worldwide since its introduction in the Brundtland Commission report more than 30 years ago (Huang, 2023).
Companies around the world have mainly relied on Corporate Social Responsibility (CSR) or Environmental, Social, and Governance (ESG) disclosure and reporting to reveal their sustainable development. From this perspective, researchers have explored the relationship between countries' governance and sustainability disclosed and reported through CSR features and ESG scores or indicators (Baldini et al., 2018; Coluccia et al., 2018; De Villiers & Marques, 2016). During the United Nations Sustainable Development Summit held in New York in September 2015, the 193 member states adopted the 2030 Agenda for Sustainable Development. The core of this agenda are the 17 SDGs (Table 1) and the 169 associated targets in areas of critical importance for humanity and the planet. These address a comprehensive array of global challenges, including ending poverty and other deprivations, developing strategies to improve health and education, reducing inequality, and spurring economic growth while tackling climate change and working to preserve oceans and forests (Bose & Khan, 2022; Huang, 2023; Rosati & Faria, 2019a; Subramaniam et al., 2023; UN, 2015).
Table 1.
Sustainable development goals (SDGs) description
SDGs | Description |
SDG 1. No poverty | End poverty in all its forms everywhere |
SDG 2. Zero hunger | End hunger, achieve food security and improved nutrition, and promote sustainable agriculture. |
SDG 3. Good health and well-being | Ensure healthy lives and promote well-being for all at all ages. |
SDG 4. Quality education | Ensure inclusive and equitable quality education and promote lifelong learning opportunities for all. |
SDG 5. Gender equality | Achieve gender equality and empower all women and girls. |
SDG 6. Clean water and sanitation | Ensure availability and sustainable management of water and sanitation for all. |
SDG 7. Affordable and clean energy | Ensure access to affordable, reliable, sustainable, and modern energy for all. |
SDG 8. Decent work and economic growth | Promote sustained, inclusive, and sustainable economic growth, full and productive employment, and decent work for all. |
SDG 9. Industry, innovation, and infrastructure | Build resilient infrastructure, promote inclusive and sustainable industrialization, and foster innovation. |
SDG 10. Reduced inequalities | Reduce inequality within and among countries. |
SDG 11. Sustainable cities and communities | Make cities and human settlements inclusive, safe, resilient, and sustainable. |
SDG 12. Responsible consumption and production | Ensure sustainable consumption and production patterns. |
SDG 13. Climate action | Take urgent action to combat climate change and its impacts. |
SDG 14. Life below water | Conserve and sustainably use the oceans, seas, and marine resources for sustainable development. |
SDG 15. Life on land | Protect, restore, and promote sustainable use of terrestrial ecosystems, sustainably manage forests, combat desertification, halt and reverse land degradation, and halt biodiversity loss. |
SDG 16. Peace, justice, and strong institutions | Promote peaceful and inclusive societies for sustainable development, provide access to justice for all, and build effective, accountable, and inclusive institutions at all levels. |
SDG 17. Partnerships for the goals | Strengthen the means of implementation and revitalize the Global Partnership for Sustainable Development. |
Note. Source: (UN, 2015:14; 2017).
The prior literature (Bose & Khan, 2022; Coluccia et al., 2018; Rosati & Faria, 2019a) in the field of countries' governance dimensions - SDGs reporting relationship was grounded on the institutional theory, which is the background for the current research. Despite no accurate definition for countries' governance, Kaufmann et al. (2010) have developed one by considering some factors of interest: (1) selection, monitoring, and replacement of governments, (2) formulation and implementation of sound government policies, and (3) citizens and state respect for government institutions. For each of the three factors, Kaufmann et al. (2010) construct two measures. The outcome consists of the six dimensions that assess countries' governance: Voice and Accountability, Political Stability and Absence of Violence/Terrorism, Government Effectiveness, Regulatory Quality, Rule of Law, and Control of Corruption.
Several studies applied the countries' governance dimensions to evaluate their relations with some factors of interest. Results on the topic are further presented. Tee et al. (2023) investigate the association between economic policy uncertainty and carbon footprint using the moderating effects of countries' governance dimensions. They provide evidence that the impact of economic policy uncertainty on total, direct, and indirect carbon emissions is reduced through the moderating effects of countries' governance dimensions. Alsaleh et al. (2021) find that bioenergy growth is positively and significantly influenced by voice and accountability, government effectiveness, and regulatory quality. Investigating European companies from the perspective of the relationship between CSR disclosure and institutional factors, Coluccia et al. (2018) find positive effects of voice and accountability, regulatory quality, and rule of law on CSR disclosure level. Furthermore, the authors’ findings support an indirect impact of control of corruption on CSR disclosed through ESG indicators. However, previous studies have not explored the influence of countries' governance dimensions on overall SDGs reporting scores. This paper endeavors to expand knowledge about the relationship between country-level factors and companies’ SDGs reporting, with a focus on reporting and non-reporting SDGs items. Thus, the research question is proposed as follows:
RQ. Does country governance have a significant impact on European companies' SDGs reporting?
In line with the six dimensions of countries' governance defined by Kaufmann et al. (2010) and investigated by Tee et al. (2023), Alsaleh et al. (2021) and Coluccia et al. (2018), the following research hypotheses are developed:
H1a. There is a positive relationship between the Voice and Accountability and European companies' SDGs reporting.
H1b. There is a positive relationship between the Political Stability and Absence of Violence/Terrorism and European companies' SDGs reporting.
H1c. There is a positive relationship between the Government Effectiveness and European companies' SDGs reporting.
H1d. There is a negative relationship between the Regulatory Quality and European companies' SDGs reporting.
H1e. There is a positive relationship between the Rule of Law and European companies' SDGs reporting.
H1f. There is a negative relationship between the Control of Corruption and European companies' SDGs reporting.
Data and methodology
Previous research reveals that the analysis of countries' governance influence on European companies' Sustainable Development Goals (SDGs) reporting is based on quantitative research. Mainly, companies' SDGs reporting was analyzed from a quantitative perspective: (1) in relation to country-level institutional factors that influence SDG reporting (Bose & Khan, 2022; Rosati & Faria, 2019a; Subramaniam et al., 2023) or (2) in relation to company-level organizational factors that influence SDG reporting (Perello-Marin et al., 2022; Rosamartina et al., 2022; Rosati & Faria, 2019b; Subramaniam et al., 2023).
This section first presents the statistical sample, then the main concepts, measures, and data sources relevant to the research variables, and it ends with the regression models.
Sample data
The statistical sample consists of 2542 companies with headquarters in European countries for 2019 - 2021, totaling 6644 panel data observations. The data sources are Thomson Reuters, World Bank Governance Indicator, and International Monetary Fund databases, also used by other researchers to analyze SDGs reporting, progress or achievement, and country governance (Bose & Khan, 2022; Rosamartina et al., 2022; Subramaniam et al., 2023; Tee et al., 2023).
Companies in the Thomson Reuters database were filtered by selecting companies headquartered in European countries. Data collection was conditioned by information related to companies' SDGs reporting in at least one year from 2019 -2021.
The sample selection process is summarized in Table 2, Panel A. The final sample consists of 6478 panel data observations across 28 countries, covering the period 2019 to 2021. Table 2, Panel B shows the country-wide distribution of companies included in the sample, which is dominated by companies with headquarters in the United Kingdom (24.53%), followed by Sweden (12.36%) and Germany (11.05%). Also, Table 2, Panel C presents the economic sector distribution of companies, which is led by companies operating in economic sectors such as Industrials (19.62%), Consumer Cyclicals (15.00%), and Financials (14.80%). Furthermore, the year 2021 accounts for the highest proportion of observations (36.63%), followed by the year 2020 (36.17%), while the year 2019 has the lowest proportion (27.20%), indicating that companies' SDGs reporting worldwide have gradually developed (Table 2, Panel D).
Table 2.
Sample selection and distribution
| Panel A: Sample selection | |||
| Number of Companies | 2542 | ||
| SDGs data covering the period 2019 – 2021 | 6644 | ||
| Less: Observations dropped due to insufficient data relevant to control | (26) | ||
| Less: Observations dropped due to insufficient data relevant to country-level | (140) | ||
| Final Sample for the period 2019 – 2021 | 6478 | ||
| Panel B: Country distribution of companies in study’s sample | |||
| Country | Number of observations | % of sample | |
| Austria | 105 | 1.62 | |
| Belgium | 147 | 2.27 | |
| Cyprus | 39 | 0.60 | |
| Czech Republic | 9 | 0.14 | |
| Denmark | 179 | 2.76 | |
| Finland | 201 | 3.10 | |
| France | 501 | 7.73 | |
| Germany | 716 | 11.05 | |
| Greece | 85 | 1.31 | |
| Hungary | 17 | 0.26 | |
| Iceland | 17 | 0.26 | |
| Ireland | 152 | 2.35 | |
| Italy | 341 | 5.26 | |
| Luxembourg | 102 | 1.57 | |
| Malta | 19 | 0.29 | |
| Netherlands | 202 | 3.12 | |
| Norway | 217 | 3.35 | |
| Poland | 112 | 1.73 | |
| Portugal | 43 | 0.66 | |
| Romania | 14 | 0.22 | |
| Russia | 107 | 1.65 | |
| Slovak Republic | 2 | 0.03 | |
| Slovenia | 5 | 0.08 | |
| Spain | 213 | 3.29 | |
| Sweden | 801 | 12.36 | |
| Switzerland | 538 | 8.31 | |
| Ukraine | 5 | 0.08 | |
| United Kingdom | 1589 | 24.53 | |
| Total Sample | 6478 | 100 | |
| Panel C: Economic sector distribution of companies in study’s sample | |||
Economic sector | Number of observations | % of sample | |
| Academic & Educational Services | 8 | 0.12 | |
| Basic Materials | 538 | 8.31 | |
| Consumer Cyclicals | 972 | 15.00 | |
| Consumer Non-Cyclicals | 399 | 6.16 | |
| Energy | 275 | 4.25 | |
| Financials | 959 | 14.80 | |
| Healthcare | 585 | 9.03 | |
| Industrials | 1271 | 19.62 | |
| Real Estate | 374 | 5.77 | |
| Technology | 893 | 13.79 | |
| Utilities | 204 | 3.15 | |
| Total Sample | 6478 | 100 | |
| Panel D: Year distribution of companies in study’s sample | |||
| Year | Number of observations | % of sample | |
| 2019 | 1762 | 27.20 | |
| 2020 | 2343 | 36.17 | |
| 2021 | 2373 | 36.63 | |
| Total Sample | 6478 | 100 | |
The 17 SDGs prepared and launched by The United Nations (UN) Sustainable Development Summit in 2015 had a period of early adoption by the UN member countries between 2016 and 2018. Starting with 2019, countries' interest in SDGs increased and maintained this growing trend, at least until 2021 (Figure 1), when data collection stopped because of information availability in the Thomson Reuters database.
Figure 1.
Distribution by years of the median and mean of the overall SDGs score of the sampled countries
Note. Countries are ranked by their overall score, which measures the total progress towards achieving all the 17 SDGs.
Research variables
To test the research hypotheses, the study approaches an econometric analysis. The dependent variable quantifies the reporting of SDGs by European companies in relation to the six dimensions of countries' governance, which act as independent variables.
Previous research aimed at analyzing SDGs reporting by companies considers as a dependent variable a specific SDGs score (Bose & Khan, 2022) or alternative measures regarding reporting or non-reporting of the SDGs (Bose & Khan, 2022; Rosati & Faria, 2019a; Subramaniam et al., 2023). This research aligns with the alternative measures by developing an SDGs reporting score. The Thomson Reuters database was accessed to collect data on SDG items reported by European companies in 2019-2021. Then, the SDGs reporting score is derived by assigning 1 to company-year observations found to report at least one SDGs item and 0 otherwise. Consequently, this is an overall score of reporting and non-reporting SDGs items, which is set as a dummy score.
Consistent with previous studies), six independent variables specific to countries' governance were used in order to seek support on embedding countries' governance in assessing companies’ SDGs reporting. For each countries’ governance dimension (Voice and Accountability, Political Stability and Absence of Violence/Terrorism, Government Effectiveness, Regulatory Quality, Rule of Law, and Control of Corruption), there is an independent variable tested through a dedicated regression equation. Data on institutional governance are obtained from the World Bank Governance Indicator (WBGI) database. The global governance indicators used are constructed based on perceptions of country governance by a large number of businesses, citizens, and experts surveyed from developed and developing countries, using a wide variety of sources to underpin the indicators (Kaufmann et al., 2007, 2010). Previous research analyzes the country’ governance indicators in relation to the field of sustainable development (Alsaleh et al., 2021; Aziz & Sarwar, 2023; Evan & Holy, 2023; Tee et al., 2023). To prevent research biases, the regression analysis controls for: (1) company’s size, Return on Assets, and financial leverage as company-level control variables: and (2) GDP growth and the degree of development of the country (emerging or advanced) as control variables at the country-level. Table 3 details information regarding concepts, measures, sources, and references relevant to the selected variables to investigate the influence of country governance on European companies' SDGs reporting.
Table 3
Research variables
| Research variables | Concepts and measures | Data sources | References | ||
| Dependent variable | |||||
| SDG: Overall SDGs reporting score | The company reports the Sustainable Development Goals (SDGs) (=1) or not (=0). Each Sustainable Development Goal (SDG) is evaluated. | Thomson Reuters | (Bose & Khan, 2022; Huang, 2023; Rosati & Faria, 2019a; Subramaniam et al., 2023) | ||
| Independent variables | |||||
| VA: Voice and Accountability | Reflects perceptions of the extent to which a country's citizens are able to participate in selecting their government, as well as freedom of expression, freedom of association, and free media. Ranges from 0 (lowest) to 100 (highest) rank. | World Bank Governance Indicator (WBGI) | (Alsaleh et al., 2021; Aziz & Sarwar, 2023; Evan & Holy, 2023; Kaufmann et al., 2007, 2010; Tee et al., 2023) | ||
| PSAVT: Political Stability and Absence of Violence/ Terrorism | Reflects perceptions of the likelihood of political instability and/or politically-motivated violence, including terrorism. Ranges from 0 (lowest) to 100 (highest) rank. |
|
| ||
| GE: Government Effectiveness | Reflects perceptions of the quality of public services, the quality of the civil service and the degree of its independence from political pressures, the quality of policy formulation and implementation, and the credibility of the government's commitment to such policies. Ranges from 0 (lowest) to 100 (highest) rank. |
|
| ||
| RQ: Regulatory Quality | Reflects perceptions of the ability of the government to formulate and implement sound policies and regulations that permit and promote private sector development. Ranges from 0 (lowest) to 100 (highest) rank. |
|
| ||
| RL: Rule of Law | Reflects perceptions of the extent to which agents have confidence in and abide by the rules of society, and in particular the quality of contract enforcement, property rights, the police, and the courts, as well as the likelihood of crime and violence. Ranges from 0 (lowest) to 100 (highest) rank. |
|
| ||
| CC: Control of Corruption | Reflects perceptions of the extent to which public power is exercised for private gain, including both petty and grand forms of corruption, as well as "capture" of the state by elites and private interests. Ranges from 0 (lowest) to 100 (highest) rank. |
|
| ||
| Company-level control variables | |||||
| Ln (TA): Company’ size | Firm’s size is computed as the natural log of total assets. | Thomson Reuters | (Tee et al., 2023) | ||
| ROA: Return on Assets | Firm’s return on assets is computed as net income scaled by the total asset. |
|
| ||
| LEV: Financial Leverage | Firm’s leverage is computed as total debt scaled by total equity. |
|
| ||
| Country-level control variables | |||||
| GDP: GDP growth | Annual gross domestic product growth rate in constant prices. | International Monetary Fund (IMF) | |||
| EA: Emerging vs Advanced | The country of the company headquarters is an emerging (=0) or advanced economy (=1). |
| |||
Regression models
The quantitative analysis relies on the linear parametric regression method was used to assess the connection between the six countries' governance dimensions as independent variables and the companies’ SDGs reporting score as the dependent variable. The econometric analysis is based on six regression equations, one for each dimension of countries’ governance. Therefore, the following six models were run to estimate the results for the analysis of the influence of countries' governance on European companies' SDGs reporting:
SDGit = β0 + β1VAct + β2Ln (TA)it + β3ROAit + β4LEVit + β5GDPct + β6EAct + gyear + Ɛit (1)
SDGit = β0 + β1PSAVTct + β2Ln (TA)it + β3ROAit + β4LEVit + β5GDPct + β6EAct + gyear + Ɛit (2)
SDGit = β0 + β1GEct + β2Ln (TA)it + β3ROAit + β4LEVit + β5GDPct + β6EAct + gyear + Ɛit (3)
SDGit = β0 + β1RQct + β2Ln (TA)it + β3ROAit + β4LEVit + β5GDPct + β6EAct + gyear + Ɛit (4)
SDGit = β0 + β1RLct + β2Ln (TA)it + β3ROAit + β4LEVit + β5GDPct + β6EAct + gyear + Ɛit (5)
SDGit = β0 + β1CCct + β2Ln (TA)it + β3ROAit + β4LEVit + β5GDPct + β6EAct + gyear + Ɛit (6)
Where SDGit is the dependent variable regarding the overall SDGs reporting score for company i in year t. VAct, PSAVTct, GEct, RQct, RLct, and CCct are the independent variables regarding the quantification of countries' governance dimensions for country c in year t. Ln(TA)it, ROAit, and LEVit are company-level control variables, also calculated for company i in year t, while GDPct and EAct are country-level control variables for country c in year t. Ɛit is the error term for company i in year t. The regression equation includes the year (γYear) as a dummy variable to control its fixed effects. To analyze econometric models, multifactorial linear regression was run using the SPSS Statistics software.
Results and discussion
Descriptive statistics
Before running the regression, preliminary tests were performed for all the variables included in the analysis. Table 4 shows the descriptive statistics of the dependent variable, as well as those of the independent and control variables, considering the total number of valid observations.
Table 4.
Descriptive statistics
| Research variables | N | Mean | St. Dev | Min | Q1 | Q2 | Q3 | Max |
| Dependent variable | ||||||||
| SDG | 6478 | 0.56 | 0.50 | 0 | 0 | 1 | 1 | 1 |
| Independent variables | ||||||||
| VA | 6478 | 90.64 | 11.75 | 17.87 | 89.37 | 93.72 | 97.10 | 100.00 |
| PSAVT | 6478 | 71.45 | 14.15 | 8.96 | 61.32 | 65.57 | 85.85 | 96.23 |
| GE | 6478 | 88.60 | 10.38 | 36.54 | 86.54 | 89.42 | 96.15 | 99.52 |
| RQ | 6478 | 89.81 | 10.39 | 32.69 | 90.87 | 93.27 | 95.19 | 99.52 |
| RL | 6478 | 88.54 | 13.21 | 20.19 | 89.42 | 91.35 | 96.63 | 100.00 |
| CC | 6478 | 89.89 | 13.23 | 19.23 | 89.90 | 94.23 | 97.12 | 100.00 |
| Company-level control variables | ||||||||
| Ln (TA) | 6478 | 21.38 | 2.16 | 11.67 | 19.91 | 21.30 | 22.75 | 28.60 |
| ROA | 6478 | 0.02 | 0.17 | -3.42 | 0.003 | 0.03 | 0.07 | 2.14 |
| LEV | 6478 | 1.26 | 15.30 | -338.60 | 0.21 | 0.58 | 1.20 | 820.26 |
| Country-level control variables | ||||||||
| GDP | 6478 | 0.56 | 5.74 | -11.32 | -2.51 | 1.60 | 5.39 | 13.59 |
| EA | 6478 | 0.96 | 0.19 | 0 | 1 | 1 | 1 | 1 |
Note. N is the total number of valid observations. The Q1, Q2, and Q3 are 25%, 50% (median), and 75% percentiles.
Within the sample, findings show that countries’ governance indicators are roughly equal on average, except for the indicator assessing perceptions of the likelihood of political instability and/or politically-motivated violence, including terrorism (PSAVT), which has the lowest mean among European countries. The countries’ governance data series have a negative skewness, with more than 50% of values larger than the mean. Literature in the field (Alsaleh et al., 2021; Tee et al., 2023) found similar differences between country’ governance indicators supporting the variables used in this study.
Regarding the overall SDGs reporting score, its average is around 56%, meaning that slightly more than half of European companies report SDGs items over 2019-2021. For different time-specific contexts, Bose & Khan (2022) and Subramaniam et al. (2023) conclude a low SDGs reporting by companies worldwide.
Table 5, Panel A, provides evidence for an increasing trend of SDGs reporting by European companies. In 2019, 41.83% of sampled companies reported SDGs items, compared to 66.54% in 2021.
Table 5.
Reporting of Sustainable Development Goals over the years
Panel A: Reporting of SDGs | ||||||||||||
Year | Reporting of SDG Items (N) | % | Non-reporting of SDG Items (N) | % | Total (N) | |||||||
2019 | 737 | 41.83 | 1025 | 58.17 | 1762 | |||||||
2020 | 1297 | 55.36 | 1046 | 44.64 | 2343 | |||||||
2021 | 1579 | 66.54 | 794 | 33.46 | 2373 | |||||||
Total | 3613 | 55.77 | 2865 | 44.23 | 6478 | |||||||
Panel B: Year-wise distribution of reporting of SDGs | ||||||||||||
Sustainable Development Goals (SDGs) | 2019 | 2020 | 2021 | Meana | ||||||||
(N=1762) | (N=2343) | (N=2373) | ||||||||||
SDG 1 |  | No poverty | 0.09 | 0.12 | 0.15 | 0.12 | ||||||
SDG 2 |  | Zero hunger | 0.07 | 0.10 | 0.13 | 0.10 | ||||||
SDG 3 |  | Good health and well-being | 0.27 | 0.37 | 0.46 | 0.37 | ||||||
SDG 4 |  | Quality education | 0.23 | 0.29 | 0.37 | 0.31 | ||||||
SDG 5 |  | Gender equality | 0.25 | 0.35 | 0.47 | 0.36 | ||||||
SDG 6 |  | Clean water and sanitation | 0.14 | 0.19 | 0.23 | 0.19 | ||||||
SDG 7 |  | Affordable and clean energy | 0.22 | 0.31 | 0.39 | 0.31 | ||||||
SDG 8 |  | Decent work and economic growth | 0.35 | 0.47 | 0.58 | 0.47 | ||||||
SDG 9 |  | Industry, innovation and infrastructure | 0.24 | 0.34 | 0.42 | 0.34 | ||||||
SDG 10 |  | Reduced inequality | 0.15 | 0.22 | 0.31 | 0.24 | ||||||
SDG 11 |  | Sustainable cities and communities | 0.20 | 0.26 | 0.32 | 0.27 | ||||||
SDG 12 |  | Responsible consumption and production | 0.31 | 0.44 | 0.54 | 0.44 | ||||||
SDG 13 |  | Climate action | 0.33 | 0.45 | 0.58 | 0.47 | ||||||
SDG 14 |  | Life below water | 0.09 | 0.12 | 0.15 | 0.12 | ||||||
SDG 15 |  | Life on land | 0.14 | 0.18 | 0.24 | 0.19 | ||||||
SDG 16 |  | Peace, justice and strong institutions | 0.17 | 0.23 | 0,30 | 0.24 | ||||||
SDG 17 |  | Partnerships to achieve the goal | 0.17 | 0.23 | 0.29 | 0.24 | ||||||
Mean | 0.20 | 0.27 | 0.35 | 0.28 | Mean | 0.20 | ||||||
Note. a Mean is computed as the average of reporting specific SDG items scaled by total number of companies. b Mean is computed as the average of company-level reporting, which is computed as the total reporting score received by each company in a particular year scaled by 17. | ||||||||||||
Analyzing the means of reporting each SDG from 2019, 2020, and 2021, Table 5, Panel B, allows the grouping of European companies in very weak, weak, and medium reporting of SDGs items (Figure 2).
Figure 2.
Mean-based SDGs reporting assessment system
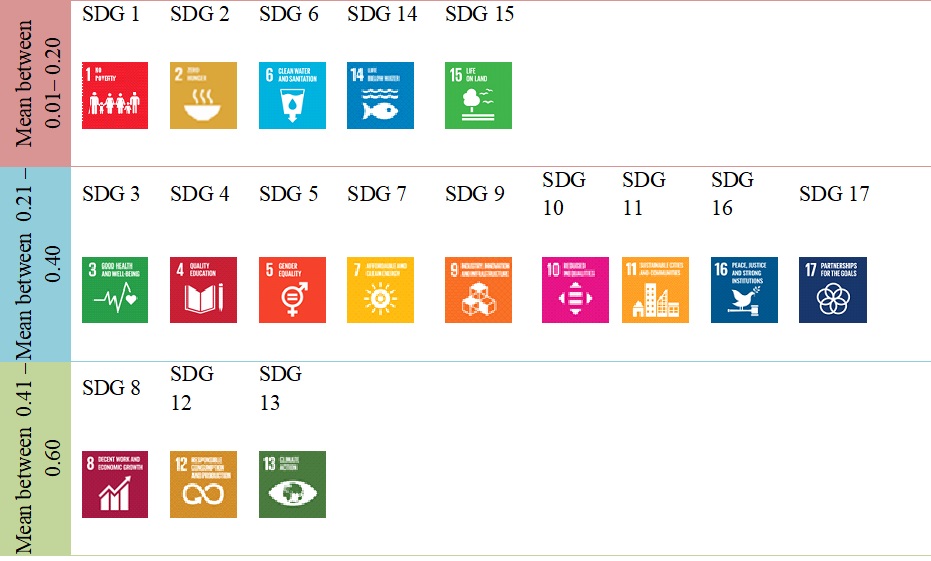
Note. SDGs are ranked by their mean of reporting by European companies. The means underscore very weak (0.01 - 0.20), weak (0.21 - 0.40) and medium (0.41 - 0.60) SDGs reporting trends.
European companies tend to support economic growth and sustainable development of the labor market (SDG 8), an objective incorporated in the social pillar of sustainable development, which is in line with Barta et al. (2023), Huang (2023) and Kostoska and Kocarev (2019). Furthermore, European companies tend to address environmental objectives regarding responsible consumption and production through efficient management of waste and chemicals (SDG 12), as well as reduction of carbon emissions to combat climate change (SDG 13). These findings are consistent with Huang (2023) and Kostoska & Kocarev (2019). Instead, low interest in European companies is observed in supporting objectives of eliminating poverty (SDG 1) and hunger (SDG 2), managing water and sanitation (SDG 6), as well as reducing the impact on aquatic (SDG 14) and terrestrial biodiversity (SDG 15).
Extrapolating the descriptive analysis of SDGs reporting by European companies, the three groups of SDGs reporting features (very weak, weak, and medium) may be similar at a country-level, according to the country where a company has its headquarters (Figure 3).
Figure 3.
Distribution by countries of the trend of SDGs reporting
To avoid distortion of the regression results, the outliers were eliminated from the initial sample using the multivariate detection method (Mahalanobis distance). Table 6 shows the final sample after data trimming outliers.
Table 6
Final sample selection and distribution
| Regression models | (1) | (2) | (3) | (4) | (5) | (6) |
| Initial Regression Sample for the period 2019 – 2021 | 6478 | 6478 | 6478 | 6478 | 6478 | 6478 |
| Outliers (Mahalanobis distance) | 171 | 69 | 84 | 176 | 178 | 177 |
| Final Regression Sample for the period 2019 – 2021 | 6307 | 6409 | 6394 | 6302 | 6300 | 6301 |
The influence of countries' governance on European companies' SDGs reporting was tested based on linear regression analysis with fixed effects.
Table 7 underscores the results for testing the research hypotheses. The influence of PSVAT on SDGs reporting is positive and statistically significant, while the influence of RQ and CC dimensions of countries' governance on SDGs reporting score is negative and statistically significant. The impacts of VA, GE, and RL are not statistically significant.
The six models are statistically valid (F < 0.01). Furthermore, collinearity was diagnosed based on the Variance Inflation Factor (VIF), taking values between 1 and 5 for all variables, similar to Alsaleh et al. (2021) and Subramaniam et al. (2023). This suggests that variables are not correlated, which ensures the validity of the analysis.
Table 7.
Regressions Results: The influence of country' governance on SDGs reporting
| SDG | (1) | (2) | (3) | (4) | (5) | (6) |
| VA | 0.001 |
|
|
|
| |
| PSVAT |
| 0.002*** |
|
|
|
|
| GE |
|
| 0.000 |
|
|
|
| RQ |
|
|
| -0.003*** |
|
|
| RL |
|
|
|
| -0.001 |
|
| CC |
|
|
|
|
| -0.002*** |
| Ln (TA) | 0.087*** | 0.089*** | 0.087*** | 0.086*** | 0.087*** | 0.086*** |
| ROA | 0.201*** | 0.221*** | 0.211*** | 0.200*** | 0.195*** | 0.201*** |
| LEV | 0.000 | 0.001 | 0.000 | 0.000 | 0.000 | 0.000 |
| GDP | 0.006** | 0.003 | 0.006** | 0.007*** | 0.007** | 0.007*** |
| EA | 0.099** | -0.034 | 0.045 | 0.176*** | 0.142*** | 0.180*** |
| YEAR dummy | Yes | Yes | Yes | Yes | Yes | Yes |
| N | 6307 | 6409 | 6394 | 6302 | 6300 | 6301 |
| Adjusted R Square | 0.180 | 0.184 | 0.180 | 0.182 | 0.180 | 0.182 |
| F test | 174.320*** | 181.993 | 177.012*** | 176.227*** | 174.145*** | 175.978*** |
| VIF | <5 | <5 | <5 | <5 | <5 | <5 |
Note. ***, **, * indicate statistical significance at the 1, 5, and 10% levels, respectively.
Findings suggest higher trends of SDGs reporting by European companies' having headquarters in countries with better political stability and low politically-motivated violence, including terrorism (PSVAT, 0.002, p-value < 0.01). These results are consistent with prior predictions of Coluccia et al. (2018), who estimated a positive relationship between PSVAT and CSR disclosure but found it to have no statistical significance (Table 8).
Furthermore, lower trends of SDGs reporting by European companies from countries with better regulatory quality (RQ, -0.003, p-value < 0.01) and high control of corruption (CC, -0.002, p-value < 0.01) were found. This contradicts Coluccia et al. (2018) and De Villiers and Marques (2016), who found a positive relationship between RQ and CSR disclosure. The negative relationship between CC and SDGs reporting is in line with previous institutional factors, such as ESG/CSR disclosure studies conducted by Baldini et al. (2018) and Coluccia et al. (2018).
Consistent with expectations, the results indicate that the biggest and most profitable companies tend to report more SDGs items than the smallest and less profitable ones. These findings are consistent with Baldini et al. (2018), Coluccia et al. (2018), and De Villiers & Marques (2016). Results for the country-level control variables emphasize higher trends of European companies' SDGs reporting in countries with growing GDP rates and an advanced degree of development.
Table 8 summarizes and compares this study’s predictions and results with Coluccia et al.’s (2018) findings, who analyzed the relationship between the countries' governance indicators and CSR disclosure, one of the most approached frameworks to debate on SDGs reporting.
Table 8.
Regressions Results: Obtained signs of influences compared with Coluccia et al. (2018)
| Variables | Research hypotheses | Predictions | Regression results | Regression results of Coluccia et al. (2018) |
| VA | H1a | + | NS | + |
| PSVAT | H1b | + | + | NS |
| GE | H1c | + | NS | NS |
| RQ | H1d | - | - | + |
| RL | H1e | + | NS | + |
| CC | H1f | - | - | - |
Note. NS = no statistical significance.
Therefore, these findings support that the PSVAT, RQ, and CC dimensions of countries' governance significantly impact European companies' SDGs reporting and validate research hypotheses H1b, H1d, and H1f. The other research hypotheses (H1a, H1c, and H1e) are not supported, as no statistical significance was found for VA, GE, and RL variables.
Conclusions
This study investigates countries' governance influence on European companies' SDGs reporting for 2019-2021. Findings show that political stability and absence of violence, including terrorism (PSVAT), as well as regulatory quality (RQ), and control of corruption (CC) significantly influence European companies' overall SDGs reporting score. These findings are partially consistent with Coluccia et al. (2018) and De Villiers and Marques (2016), who found positive influences of VA, GE, RQ, and RL countries' governance dimensions on CSR disclosure and reporting. However, the control of corruption (CC) dimension is negatively related to CSR disclosure and reporting (Coluccia et al., 2018). Baldini et al. (2018) find that the strength of the formal institution (Legal Framework, which is similar to RQ) and public power exercised for private gain (CC) are negatively associated with ESG disclosure. This study validates these findings by proofing an indirect and significant relation between control of corruption and European companies’ overall SDGs reporting score. These results are obtained in the context of an average of 56% for the overall SDGs reporting score computed for European companies from 2019-2021.
Furthermore, this research found that European companies tend to support economic growth and sustainable development of the labor market (SDG 8), address environmental objectives regarding responsible consumption and production through efficient management of waste and chemicals (SDG 12), as well as reduction of carbon emissions to combat climate change (SDG 13).
This study fills the gap in countries' governance research in relation to companies' SDGs reporting, which helps develop future research. However, this study has certain limitations regarding the sample period and the selection of European companies from all economic sectors. Furthermore, using the overall SDGs reporting score computed as a dummy variable, assigning 1 to company-year observations found to report at least one SDGs item and 0 otherwise may influence the analysis in terms of treating companies reporting only one SDG similar to companies reporting two or more. Future research should address other methods of quantifying the score of companies' SDGs reporting as alternative measures of assessing sustainability.
References
Alsaleh, M., Abdul-Rahim, A. S., & Abdulwakil, M. M. (2021). The importance of worldwide governance indicators for transitions toward sustainable bioenergy industry. Journal of Environmental Management, 294, 1-13. https://doi.org/10.1016/j.jenvman.2021.112960
Aziz, G., & Sarwar, S. (2023). Revisit the role of governance indicators to achieve sustainable economic growth of Saudi Arabia – pre and post implementation of 2030 Vision. Structural Change and Economic Dynamics, 66, 213-227. https://doi.org/10.1016/j.strueco.2023.04.008
Baldini, M., Dal Maso, L., Liberatore, G., Mazzi, F., & Terzani, S. (2018). Role of Country- and Firm-Level Determinants in Environmental, Social, and Governance Disclosure. Journal of Business Ethics, 150, 79-98. http://dx.doi.org/10.1007/s10551-016-3139-1
Barta, S., Belanche, D., Flavián, M., & Terré, M. C. (2023). How implementing the UN sustainable development goals affects customers’ perceptions and loyalty. Journal of Environmental Management, 331, 1-10. https://doi.org/10.1016/j.jenvman.2023.117325
Bose, S., & Khan, H. Z. (2022). Sustainable development goals (SDGs) reporting and the role of country-level institutional factors: International evidence. Journal of Cleaner Production, 335, 1-13. https://doi.org/10.1016/j.jclepro.2021.130290
Caby, J., Ziane, Y., & Lamarque, E. (2022). The impact of climate change management on banks profitability. Journal of Business Research, 142, 412-422. https://doi.org/10.1016/j.jbusres.2021.12.078
Coluccia, D., Fontana, S., & Solimene, S. (2018). Does Institutional Context Affect CSR Disclosure? A Study on Eurostoxx 50. Sustainability, 10(8), 1-20. https://doi.org/10.3390/su10082823
De Villiers, C., & Marques, A. (2016). Corporate social responsibility: Country-level predispositions, and the consequences of choosing a level of disclosure. Accounting and Business Research, 46(2), 167-195. https://doi.org/10.1080/00014788.2015.1039476
Evan, T., & Holý, V. (2023). Cultural diversity and its impact on governance. Socio-Economic Planning Sciences, 89, 1-13. https://doi.org/10.1016/j.seps.2023.101681
Huang, R. (2023). SDG-oriented sustainability assessment for Central and Eastern European countries. Environmental and Sustainability Indicators, 19, 1-16. https://doi.org/10.1016/j.indic.2023.100268
Kaufmann, D., Kraay, A., & Mastruzzi, M. (2007). The Worldwide Governance Indicators Project: Answering the Critics. World Bank Policy Research Working Paper, 4149, 1-34. https://ssrn.com/abstract=965077
Kaufmann, D., Kraay, A., & Mastruzzi, M. (2010). The Worldwide Governance Indicators: Methodology and Analytical Issues. World Bank Policy Research Working Paper, 5430, 1-31. https://ssrn.com/abstract=1682130
Kostoska, O., & Kocarev, L. (2019). A Novel ICT Framework for Sustainable Development Goals. Sustainability, 11(7), 1-31. https://doi.org/10.3390/su11071961
Perello-Marin, M. R., Rodríguez-Rodríguez, R., & Alfaro-Saiz, J. J. (2022). Analysing GRI reports for the disclosure of SDG contribution in European car manufacturers. Technological Forecasting & Social Change, 181, 1-10, https://doi.org/10.1016/j.techfore.2022.121744
Rosamartina, S., Giustina, S., Domenico, D. F., Pasquale, D. V., & Angeloantonio, R. (2022). Digital reputation and firm performance: The moderating role of firm orientation towards sustainable development goals (SDGs). Journal of Business Research, 152, 315-325. https://doi.org/10.1016/j.jbusres.2022.07.025
Rosati, F., & Faria, L. G. (2019a). Addressing the SDGs in sustainability reports: The relationship with institutional factors. Journal of Cleaner Production, 215, 1312-1326. https://doi.org/10.1016/j.jclepro.2018.12.107
Rosati, F., & Faria, L. G. (2019b). Business contribution to the Sustainable Development Agenda: Organizational factors related to early adoption of SDG reporting. Corporate Social Responsibility and Environmental Management, 26(3), 588-597. https://doi.org/10.1002/csr.1705
Subramaniam, N., Akbar, S., Situ, H., Ji, S., & Parikh, N. (2023). Sustainable development goal reporting: Contrasting effects of institutional and organisational factors. Journal of Cleaner Production, 411, 1-14. https://doi.org/10.1016/j.jclepro.2023.137339
Tee, C. M., Wong, W. Y., & Hooy, C. W. (2023). Economic policy uncertainty and carbon footprint: International evidence. Journal of Multinational Financial Management, 67, 1-23. https://doi.org/10.1016/j.mulfin.2023.100785
UN. (1987). Brundtland Commission. Our Common Future: Report of the World Commission on Environment and Development
UN. (2015). Transforming our world: The 2030 Agenda for Sustainable Development. A/RES/70/1. https://www.un.org/en/development/desa/population/migration/generalassembly/docs/globalcompact/A_RES_70_1_E.pdf
UN. (2017). United Nations. Sustainable development goals: 17 goals to transform our world. https://www.un.org/sustainabledevelopment/sustainable-development-goals/
Page 1 of
Download Count : 196
Visit Count : 449
Keywords
Countries Governance; Sustainable Development Goals (SDGs); Companies; Sustainability; Econometric Analysis
Author(s) Information

How to cite this article:
Bancu, E.A., & Dascalu, C. (2024). Embedding Countries Governance in Assessing Companies' Sustainable Development Goals (SDGs) Reporting: A Quantitative Analysis. European Journal of Studies in Management and Business, 29, 1-17. https://doi.org/10.32038/mbrq.2024.29.01
Acknowledgments
This paper was presented at the 9th International Hybrid Conference on Management Studies (ICMS). This paper was co-financed by The Bucharest University of Economic Studies during PhD program.
Funding
Not applicable.
Conflict of Interests
No, there are no conflicting interests.
Open Access
This article is licensed under a Creative Commons Attribution 4.0 International License, which permits use, sharing, adaptation, distribution and reproduction in any medium or format, as long as you give appropriate credit to the original author(s) and the source, provide a link to the Creative Commons license, and indicate if changes were made. You may view a copy of Creative Commons Attribution 4.0 International License here: http://creativecommons.org/licenses/by/4.0/