


Original Research
Brand Equity and Customer Life Cycle in Start-Ups
- Abstract
- Full text
- Metrics
The relationship between brand equity and the customer life cycle has garnered increasing attention, especially in the context of start-ups where establishing a solid brand presence is crucial for long-term success. This research investigated the relationship between brand equity and the customer life cycle of start-up firms. The study examined the influence of brand awareness, brand loyalty, perceived quality, and brand associations on customer acquisition, retention, and advocacy, drawing on Keller's Customer-Based Brand Equity Theory and the Customer Life Cycle Theory. The study employed a quantitative approach, utilizing a structured questionnaire to explore the perception and interaction of start-up customers with the brand. Data analysis was examined through Structural Equation Modelling (SEM) to get a statistically significant association between constructs. Noteworthy are the high correlations observed, especially between Perceived Quality 2 (PQ2) and Perceived Quality 3 (PQ3), as well as between Brand Loyalty (BL) and Brand Association 2 (BrA2). The findings demonstrate that creating favourable brand associations is indeed a powerful tool in building a loyal customer base, and that an increase in specific quality features can have a stronger emotional impact on customers.
Brand Equity and Customer Life Cycle in Start-Ups
Michael Oyedele Oyenuga1,* & Chok Nyen Vu2
1School of Business, Woxsen University, Telangana, India
2Manipal Globalnxt University, Malaysia
ABSTRACT
The relationship between brand equity and the customer life cycle has garnered increasing attention, especially in the context of start-ups where establishing a solid brand presence is crucial for long-term success. This research investigated the relationship between brand equity and the customer life cycle of start-up firms. The study examined the influence of brand awareness, brand loyalty, perceived quality, and brand associations on customer acquisition, retention, and advocacy, drawing on Keller's Customer-Based Brand Equity Theory and the Customer Life Cycle Theory. The study employed a quantitative approach, utilizing a structured questionnaire to explore the perception and interaction of start-up customers with the brand. Data analysis was examined through Structural Equation Modelling (SEM) to get a statistically significant association between constructs. Noteworthy are the high correlations observed, especially between Perceived Quality 2 (PQ2) and Perceived Quality 3 (PQ3), as well as between Brand Loyalty (BL) and Brand Association 2 (BrA2). The findings demonstrate that creating favourable brand associations is indeed a powerful tool in building a loyal customer base, and that an increase in specific quality features can have a stronger emotional impact on customers.
KEYWORDS : Brand Awareness, Brand Equity, Brand Loyalty, Customer Life-Cycle, Start-Ups
There has been a significant focus on brand equity in recent years, particularly for start-ups struggling to differentiate themselves in a crowded market. Brand equity is the intrinsic worth that consumers attribute to a product or service of a particular brand, based on their perception, experience, and behavior towards that brand (Ebeid, 2014; Oyenuga et al., 2021). For start-ups, brand building is not a marketing exercise, it is a successive set of choices about how the organisation can achieve impact within the external market forces to its internal capabilities (Bambauer-Sachse & Mangold, 2011) Start-up companies contest traditional brand management concepts because they frequently operate on a limited budget and maintain a nascent customer base, forcing them to employ progressive brand management strategies to create strong brand equity early in their life cycle.
The selected determinants for the study are brand awareness, brand associations, perceived quality and brand loyalty the four that are known as the dimensions of customer based brand equity define a set of relationships between customers and brands (Hakala et al, 2012; Severi & Ling, 2013) that also are of socio cultural nature since the consumer-brand interactions at each of the stages of the customer life cycle have a great impact on the overall brand equity as well as customer loyalty (Cerna & Schneider, 2023). Similarly, changes in digital marketing channels have disrupted start-ups’ handling of their brand equity. Notably, one of the most effective platforms, social media, appears to manipulate customers' perceptions and contribute to brand relationship equity (Abdullah & Siraj, 2016; Oyenuga et al., 2023b).
When the word-of-mouth feedback from the audience is negative, it reflects the importance of paying close attention to building a good and positive brand experience, as it can significantly influence customers' loyalty and recommendations (Alam et al., 2024; Bambauer-Sachse & Mangold, 2011). While one of the challenges in the digital arena for new venture management is striking a balance between the positive potential for brand exposure and the potential dangers of the degree of fidelity that might occur in customer feedback (Cerna & Schneider, 2023), start-ups need engagement strategies to develop a basic level of brand equity. The objective of this study is to understand and explain the differences in the functioning of brand equity across the four customer life cycle stages of start-ups, offering insights into good-practice brand deployment around start-ups. This study aims to address the gap in the burgeoning brand equity literature while providing action-oriented advice for start-up firms to nurture long-term relationships with their customers. It examines the confluence of branding strategies and customer engagement mapping across the various stages of the consumer life journey. In brief, at a phase where start-ups are destined to contend with the tribulations of established brands, brand value nurtured via hyper-targeted engagement techniques will be the x-factor that sets their journey in a competitive ecosystem.
Statement of the Problem
Branding has been increasingly important in the current market, as many start-ups will compete for customer loyalty and growth. That said, many start-ups find themselves struggling to strike a balance between building brand equity and navigating the various stages of the customer life cycle simultaneously. While brand equity is progressively recognized as a key asset (Marcus et al., 2020), the mechanisms through which start-ups can build loyalty and long-term relationships with their clients remain largely understood. It has been argued that holistic approaches to assessing brand equity overlook the dynamism of interactions along the customer life cycle, which can result in ineffective branding strategies that fail to connect with the target audience (Anselmsson et al., 2017). Moreover, in the start-up scenario, insufficient resources and fluctuating market trends complicate building brand equity, which relies on consumers' perception and ongoing loyalty as well as the creation of distinctive brand associations (Oyenuga et al, 2023a; 2023b; Sontaite-Petkeviciene, 2020; Shamma & Hassan, 2011).
Moreover, the increasing importance of digital touchpoints in brand interactions has also transformed the environment for start-ups. As social and digital media continued to rise as economic media, traditional brand equity-building marketing strategies faltered and did not translate effectively (Showrav & Nitu, 2018); today, we live in a world of responsive media and brand experiences. To do so, start-ups need to understand the points of contact that shape customer perceptions throughout the customer life cycle, from audience awareness to post-purchase advocacy, and utilize this as a source of brand equity and competitive edge (Davcik et al., 2013). Furthermore, exploring the interplay between brand equity and customer life cycle aspects could lead to more in-depth research into how specific elements of brand equity, such as brand awareness, perceived quality, and customer satisfaction, impact consumer behaviour at different stages of the customer journey. Most prior studies have focused on these constructs individually, overlooking the potential synergistic effects of examining them together (Kataria & Saini, 2019; Pandian, 2020). Therefore, understanding the hybrid role of brand equity in the customer life cycle context for start-ups is necessary to investigate best practices that can elevate customer relationships to a higher phase, ultimately building long-term brand loyalty.
Concisely, though brand equity has also been classified as an important dimension for the success of businesses, the opportunities and mechanisms of building this equity based on customer life cycles and for start-ups are not yet fully uncovered. This study aims to fill the research gap by exploring how startups (young firms) strategically manage brand equity throughout the customer life cycle to create long-lasting brand relationships with customers and generate sustainable firm growth.
Objectives
1. The objective of the current study is to examine the key dimensions of brand equity for start-ups.
2. The study will examine how brand equity impacts different customer life cycle stages in the context of start-ups.
3. This goal seeks to investigate how customer perceptions of equity change throughout interaction with start-ups.
4. To come up with strategies for start-ups to effectively manage their brand equity.
Hypotheses
H1: Higher levels of brand awareness lead to increased brand loyalty among customers of start-ups.
H2: Brand quality positively influences customer satisfaction and retention throughout the customer life cycle.
H3: Brand awareness positively influences brand equity and brand loyalty in start-ups.
H4: Brand association positively correlates with improved customer engagement and advocacy in the customer life cycle.
Literature Review
Introduction to Brand Equity
There are multiple ways in which companies can define brand equity. Aaker (1991) provides one of the most widely adopted definitions of brand equity, anchoring it to a combination of assets related to a brand, which includes, inter alia, brand awareness, brand loyalty, brand associations, and perceived quality (Ebeid, 2014). This model suggests that the perception of these collective dimensions helps define the equity of a brand. Keller (1993) subsequently built on this concept by developing the idea of Consumer-Based Brand Equity (CBBE), which posits that the strength of a brand in the market is determined by what customers perceive and experience (Brakus et al., 2009).
Definition and Conceptual Framework
Brand equity refers to the value that a company creates from a product or service with a name compared to a generic equivalent, based on people’s perception of brands. According to Aaker (1991), brand equity is “a set of assets and liabilities linked to a brand, its name and symbol that add to or subtract from the value provided by a product or service” and consists of: brand awareness, brand associations, perceived quality, brand loyalty and other proprietary brand assets as shown in Figure 1. The broad implication is that strong brand equity can lead to greater customer loyalty, premium pricing, and more advantageous market positioning (Pınar et al., 2020).
Conceptual Framework for Brand Equity and Customer Life Cycle
Brand equity interaction with the customer life cycle involves obtaining interest based on different consumer involvement stages, from awareness to post-purchase and evaluation. The conceptual framework posited integrates critical dimensions of brand equity with distinct customer life cycle stages:
1. Brand Awareness and Engagement: The customer life cycle starts with brand awareness. The consumers become aware of the brand, and this is where first impressions come into question. It involves cognitive facets where prospective buyers are aware of and remember the brand. The more consumers are familiar with a brand, the more likely they are to recall it in the future and react positively to it (Pınar, 2020; Romaniuk et al., 2017).
2. Brand Association and Consideration: After creating initial awareness, the strength of brand associations impacts consumer consideration. Brand associations include the attributes, benefits, and experiences associated with the brand, which play a major role in consumer selection. Positive and strong associations can improve perceived quality, facilitating the customer’s decision-making during this pivotal evaluation state (Dada, 2021; Li, 2022).
3. Perceived Quality and Purchase Decision: At the purchase decision stage, the perceived quality, i.e. the evaluation of the brand’s quality by consumers as compared to the quality of competitor (s), acts as a driving factor. High-quality perception increases the likelihood of purchase (Erdem & Swait́, 2016): consumers are willing to pay more for high-quality brands. Unsurprisingly, marketing and customer experience strategies will play a role in establishing a perception of quality during this stage.
Building brand loyalty post-purchase is vital for long-term success. Brand loyalty goes beyond buying behaviour and technical endorsement: by creating emotional bonds with customers, advocates can have a significant impact on acquiring new customers through word-of-mouth. Brands that enjoy better loyalty metrics are more resilient to competitive pressures and market changes (Sasmita & Suki, 2015; Seehanam et al., 2018). Enhanced post-purchase customer engagement through targeted communication can also benefit customer satisfaction and reinforce loyalty.
Feedback Loop for Continuous Improvement: The framework highlights the importance of feedback loops from different stages back into the brand strategy formula. Startups can track data on all aspects of consumer perceptions and behaviors along the customer life cycle, identifying gaps in need of improvement and continuing to reinforce positive in-market experiences that enhance brand equity (Boukis & Christodoulides, 2018). Ongoing evaluation can assist in adjusting strategies to changing market conditions and consumer preferences.
Brand Equity Model
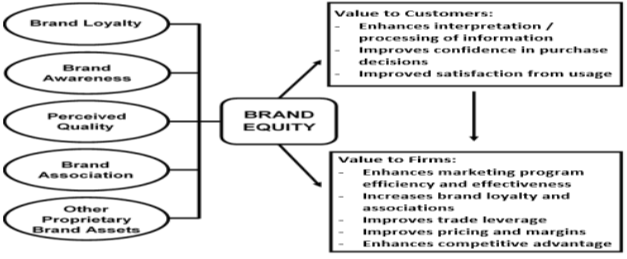
Source: Adapted from Managing Brand Equity: Capitalizing on The Value of a Brand Name, by Aaker, 1991.
Integration of Brand Equity with the Customer Life Cycle
As the startup scene evolved, so did the need to understand how brand equity interacted with the customer life cycle. Given that startups encounter challenges due to low market presence and limited resources (Ma et al., 2024), understanding brand equity can serve as a compass pointing toward ideal customer engagement strategies across the stages of the life cycle, from awareness to loyalty. For start-ups, the awareness stage is all about building brand awareness. Brand awareness is not only a first impression, but also a strong predictor of future purchase intentions (Dada, 2021). At this point, using digital marketing strategies to build visibility and brand recall is crucial.
At the consideration stage, brand associations are also important. Startups need to create a thorough messaging and better positioning. A positive association with a brand is one of the factors that influence customers, especially if the brand is in a competitive scenario in which customers have many alternatives (Erdem & Swait́, 2016).
The Decision Stage drives perceived quality and brand health. In other words, a startup should accomplish a goal of meeting customer expectations to solidify which impression of the brand ends up being the Quality Perception, wherein the reaffirmations further influence the buying decision. A strong association with high quality enables start-ups to perform better against existing brands (Sasmita & Suki, 2015).
Following purchase, at the Loyalty Stage, brand loyalty must be developed. According to previous research, satisfied customers tend to become repeat customers and promote the brand to others, which benefits new customer acquisition through word of mouth (Seehanam et al., 2018). Developing programs of customer loyalty and customer engagement marketing can provide stronger emotional bonds and further increase brand equity.
Overview of Customer Life Cycle Concepts
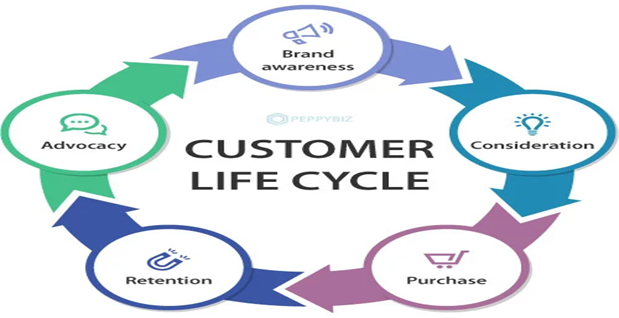
The customer life cycle is the journey a consumer goes through from awareness to becoming a loyal brand ambassador. This journey can be divided into different phases: awareness, consideration, purchase, loyalty, and advocacy, as shown in Figure 2. Each stage represents a different interaction of the customer with the brand and therefore requires a unique set of marketing strategies and tactics that are beneficial to enhancing the customer experience at every stage (Jiménez‐Zarco et al., 2023). These stages are essential for businesses, particularly those in their infancy, to comprehend so that they can intelligently allocate resources and adopt personalised strategies that accommodate the requirements of clients, depending on where they are in the life cycle. Effective customer engagement through these stages also contributes to higher conversion rates, better customer retention, and ultimately defines a brand’s success over time (Avdımıotıs & Poulaki, 2019).
Customer Life Cycle Model
Stages of the Customer Life Cycle
Awareness: This is a crucial part of the process, as it sets the stage for future interaction. At this point, companies can employ different marketing methods, such as digital ads, content marketing, and social media use, to target possible clients. Brand awareness is so significant that the potential customers who have a high level of awareness of a brand will spend less time deciding and therefore favour that brand over the options (Jiménez‐Zarco et al., 2023).
Consideration: Following awareness comes the consideration stage, during which customers evaluate their options before making a decision. This stage involves researching similar products or services and evaluating the value of what different brands have to offer. This requires brands to deliver in-depth information, including customer endorsements and comparisons with competitors, that can assist in the evaluation process. The companies should focus on producing trustworthy content, leveraging reviews, and presenting their unique selling points (USPs) to shape a customer's mindset towards a positive assessment of their offering (Barwitz & Maas, 2018).
Purchase: The purchase stage represents the moment a customer chooses to purchase a product or service. Factors that impact this decision may include promotional offers, streamlined purchasing processes, and communication strategies used by the organisation. Brands (especially startups) should allow for a seamless and easy purchasing process to maximise conversions. This can be achieved through outstanding flexibility in payment methods, clear visibility of the item's price, and effective customer service to minimize customer buying resistance barriers (Wondiwoy & Yansen, 2023). Improved satisfaction at this stage can create positive emotional perceptions of the brand, which in turn support future experiences.
Loyalty/Retention: After a purchase, the objective is to build loyalty and make customers return to buy. Brand loyalty is characterized as the consistent favouring of one brand over all others and is often a result of positive experiences and satisfaction with past interactions. Encouraging loyalty depends on building direct, simple, and positive experiences that allow consumers to share their feedback and experiences with the companies. Loyal customers are less price-sensitive when it comes to price increases, and they also generate sales through repeat purchases as well as referral marketing (Jiménez‐Zarco et al., 2023). Developing customer loyalty is crucial to long-term sustainability, particularly for startups seeking to establish a foothold in competitive environments.
Advocacy: Advocacy is the last stage in the customer life cycle, where the loyal customers refer the brand to others. Advocacy works wonders because word-of-mouth referrals are major deciding factors for prospective customers. Whether it is referral programs, customer engagement initiatives, or rewarding customers for sharing their positive experiences on social media. In addition, high levels of brand advocacy imply high levels of loyalty to the brand, as well as a high value (Cambra-Fierro et al., 2018).
Interrelationship Between Brand Equity and Customer Life Cycle
Brand equity refers to the strength of a brand in the market, as revealed during the purchasing process, and it is heavily influenced by the interrelationship between brand equity and the customer life cycle. By recognizing this connection, businesses, especially startups, can develop strategies that enhance the customer experience and foster brand loyalty.
Theoretical Underpinning for the Study of Brand Equity and Customer Life Cycle in Start-Ups
In examining the intricate relationship between brand equity and the customer life cycle, a combination of relevant theories provides a robust theoretical framework that guides this exploration. The key theories that align well with this study are Keller’s Brand Equity Theory and the Customer Life Cycle Theory.
Keller’s Brand Equity Theory
Keller’s Brand Equity Theory, or the Customer-Based Brand Equity (CBBE) model, was developed by Kevin Lane Keller in 1993. Keller argued that brand equity must be understood in the context of consumer perceptions, and that a brand's strength is essentially the extent to which the brand is understood and adopted by consumers. His framework identified four dimensions of brand equity: brand awareness, brand associations, perceived quality, and brand loyalty, all of which collectively shape consumers' overall experiences of brand equity (Miller et al., 2014). This perspective underscores the importance of brand associations and awareness formation as fundamental approaches to enhancing brand performance and loyalty. It understands that brand perceptions at each stage of the journey can shape whether consumers are going to buy, as well as their loyalty in the long run. Keller's research has become foundational in the field of brand management, offering a structured approach to thinking about brand equity and consumer behavior. Each dimension helps establish a brand's total value to a consumer and is integral to the customer life cycle. This hypothesis aligns with the study's aims, as it explains how strong brand equity supports each part of the customer life cycle effectively. Strong awareness leads to improved customer acquisition, while strong loyalty contributes to customer retention. These ensure insight into the ways startups build and leverage brand equity to pass through the customer life cycle.
Customer Life Cycle Theory
While this theory is arguably the work of many, drawing on decades of scholarship from various marketing academics in the 20th century, it has evolved significantly through research on consumer behavior, particularly those exploring how businesses can effectively manage relationships with consumers (Wann et al., 2017). It is based on the idea that customers go through five stages (awareness, consideration, purchase, loyalty, and advocacy) in their relationship with a brand. Offering effective management at various stages enables the utilization of brand equity metrics to optimize marketing strategies, enhance customer satisfaction, and boost retention. This strategic approach enables businesses to develop initiatives tailored to each touchpoint, ensuring a more personalized experience that not only enhances customer satisfaction but also fosters brand loyalty.
This theory relates to the study of focus as it shows consumer behaviour at the cycle of life, customers are exposed to their brand equity. For instance, good brand experiences translate to increased brand loyalty that helps keep the customer engaged with the brand for an extended period while decreasing churn rates and increasing customer value. The theory further explains the changing expectations from customers and relationships throughout the life cycle, so a startup needs to adapt to these changes. Such adaptability is critical to building and maintaining brand equity.
Integrated Framework
Keller’s (1993) Brand Equity Theory, combined with the Customer Life Cycle Theory, provides a robust model to analyse the role of brand equity in startups. This bird's-eye view contributed to understanding the overall relationship between gist, behavioral outcome, and awareness, loyalty, and perceived quality; and simultaneously, the granular relationship between these constructs (brand equity) and behavioral outcome across the customer life cycle.
Customer Acquisition: Startups can use brand equity to draw customer awareness and assist with moving customers from awareness to consideration. A high perception of risk is less known, as it is more likely that customers who choose the brand will also choose competitors.
Customer Retention: Description of the theory indicates perception of sustainable relationships with clients via loyalty techniques and renewal of brand equity. For years, we have seen the advent of subscription and “subscription-like” business models.
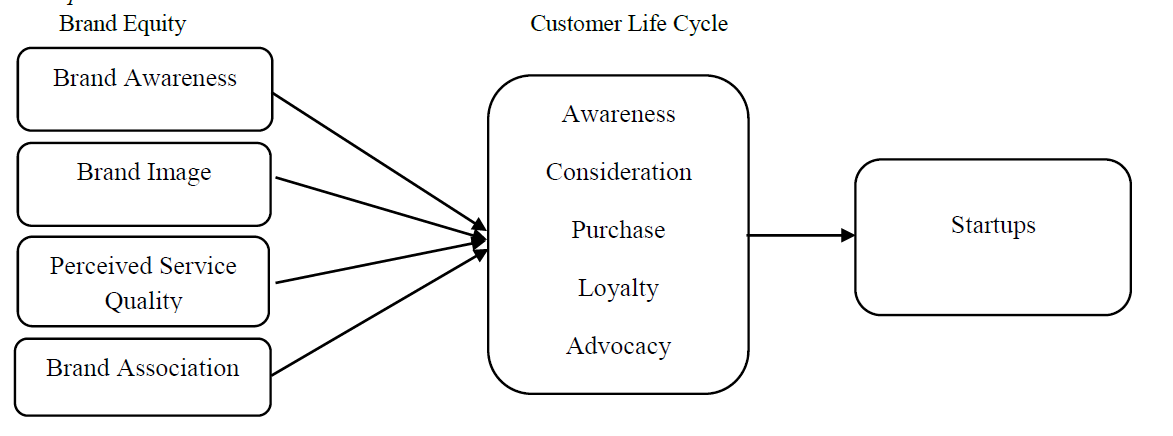
Influence on Purchase Intentions: The correlation between brand awareness and purchase intention can be explained by the fact that increased brand equity can drive significantly better conversion rates during the later purchase stage, which is critical for startup revenue generation. This is depicted in Figure 3.
Conceptual Framework
Method
Research Design
Thus, this study used a descriptive cross-sectional survey design. This serves well for quantitatively measuring the associations between brand equity components (i.e., brand awareness, brand loyalty, perceived quality, and brand association) and customer behaviour, as related to specific stages of the life cycle. Using a cross-sectional design, the researcher collected data from a diverse sample at a single point in time through the administration of an online questionnaire.
Population and Sampling
The population for this study is customers and potential customers of the selected fashion startup in India. Since the chosen company is in the fashion industry, young adults were targeted as respondents. The target sample size was set at a maximum of 200 respondents to ensure adequate statistical power for the analysis. This sample size is justified since it allows for a sufficient representation of the entire customer base and conclusions that can be generalised.
Data Collection
The survey was customised to measure the dimensions of brand equity and its impacts on the different phases of a customer life cycle. The survey included quantitative questions using Likert scales to determine perceptions of brand awareness, loyalty, perceived quality, and associations. A questionnaire was designed using Google Forms and was circulated online through WhatsApp to respondents.
Model Specification
The study developed a conceptual model with the anticipated links between the dimensions of brand equity and customer life cycle stages. We specified the model using the Structural Equation Model (SEM) based on the relationships between customer retention, brand awareness, perceived quality, and brand loyalty. The hypothesised model assessed direct effects such as the impact of brand awareness on consideration and purchase intentions, as well as indirect effects where perceived quality acts as a mediator between brand equity and customer satisfaction.
Statistical Tools and Packages for Analysis
Statistical analyses were completed by using Jamovi and AMOS (Analysis of Moment Structures) software. Descriptive statistics, reliability and preliminary correlations were conducted using SPSS. Then, using SEM in AMOS to test the proposed substrate relationships in the model. These instruments enabled extensive quantitative analysis, facilitating the drawing of conclusions and understanding of effects within the various aspects of the experimental measures.
Findings and Analysis
Frequencies
From Table 1, the "18-24" age band contains the largest proportion of entries in the dataset, with 58 individuals, representing 84.1% of the entire population. However, the 25-34 one is also part of a lower percentage. The majority is important, as they use the brand the most, so they are in the best position to provide useful feedback on the variables it measures.
|
Frequencies of Age |
|||
|
Age |
Counts |
% of Total |
Cumulative % |
|
18 - 24 |
58 |
84.1% |
84.1% |
|
25 - 34 |
11 |
15.9% |
100.0% |
According to Table 2, 29 females account for 42.0% of the population. The cumulative percentage represents 42.0% of the total population, comprising 40 males, while the remaining 58.0% is made up of females. With a combined percentage of 100.0%, it indicates that males and females comprise the whole of the data.
|
Frequencies of Gender |
|||
|
Gender |
Counts |
% of Total |
Cumulative % |
|
Female |
29 |
42.0% |
42.0% |
|
Male |
40 |
58.0% |
100.0% |
According to Table 3, 16 people hold a Bachelor's degree, which is equivalent to 23.2% of the population. The cumulative percentage reveals that 23.2% of the dataset is of this education level. Most of the dataset has a Master’s Degree (in number of people: 53; in percentage: 76.8%). Being the final category, the cumulative percentage totals 100% (the data is fully utilised). The result from the respondents' educational level indicates that they are knowledgeable about the questionnaire issue.
|
Table 3 Frequencies of Education Level |
|||
|
Education Level |
Counts |
% of Total |
Cumulative % |
|
Bachelor's Degree |
16 |
23.2% |
23.2% |
|
Master's Degree |
53 |
76.8% |
100.0% |
According to Table 4, only two respondents are employed full-time, which is 2.9% of the entire population. An additional 1 person is self-employed, making 1.4% of the population, and together, these two groups account for 4.3% of the population. Most respondents (65) are students, who account for 94.2% of the dataset. The total percentage is 98.6%, indicating that students are the majority group. However, 1 person is not in employment, which is 1.4% of the population.
|
Frequencies of Occupation |
|||
|
Occupation |
Counts |
% of Total |
Cumulative % |
|
Employed (Full-time) |
2 |
2.9% |
2.9% |
|
Self-employed |
1 |
1.4% |
4.3% |
|
Student |
65 |
94.2% |
98.6% |
|
Unemployed |
1 |
1.4% |
100.0% |
Structural Equation Models
Table 5 presents the model estimation results using Diagonally Weighted Least Squares (DWLS) with Nonlinear Minimization (NLMIN) optimisation. The model was based on 69 observations with 80 free parameters and employed robust standard errors to ensure reliable variance estimates. A scaled test statistic, mean adjusted and shifted, was used to assess model fit. The convergence of the model within 57 iterations indicates numerical stability. The latent construct Exogenous1 was modelled using indicators such as BA, BL, PQ, and BrA variables, while Endogenous1 was measured using four CL indicators. These results support the structural validity of the model and provide a basis for interpreting path relationships in subsequent analysis.
Models Info
|
Estimation Method |
DWLS |
|
Optimization Method |
NLMIN |
|
Number of observations |
B 69 |
|
Free parameters |
80 |
|
Standard errors |
Robust |
|
Scaled test |
Mean adjusted scaled and shifted |
|
Converged |
TRUE |
|
Iterations |
57 |
|
Model |
Exogenous1=~BA1+BA2+BA3+BL1+BL2+BL3+PQ1+PQ2+PQ3+BrA1+BrA2+BrA3 Endogenous1=~CL1+CL2+CL3+CL4 |
Note. Variable (BA1,BA2,BA3,BL1,BL2,BL3,PQ1,PQ2,PQ3,BrA1,BrA2,BrA3,CL1,CL2,CL3,CL4) has been coerced to ordered type. Lavaan->lav_model_vcov(): The variance-covariance matrix of the estimated parameters (vcov) does not appear to be positive definite
Overall Tests
Table 6 presents the results of the model fit tests, comparing the user-specified model to a baseline model. The chi-square value for the User Model is 249 with 103 degrees of freedom, yielding a p-value of less than .001, indicating that the model fit is statistically significant. Similarly, the Scaled User Model shows a chi-square of 270 (df = 103, p < .001), which further supports the robustness of the model estimation under adjusted conditions. In contrast, the Baseline Model and its scaled counterpart display substantially higher chi-square values (6165 and 2131, respectively), both with 120 degrees of freedom and p < .001. These differences reinforce the superior fit of the user model over the null model, lending confidence to its structural adequacy for subsequent analyses.
|
Model Tests |
|
||
|
Label |
X² |
df |
p |
|
User Model |
249 |
103 |
<.001 |
|
Baseline Model |
6165 |
120 |
<.001 |
|
Scaled User |
270 |
103 |
<.001 |
|
Scaled Baseline |
2131 |
120 |
<.001 |
Table 7 reports the fit indices across Classical, Robust, and Scaled estimation approaches, offering insights into the model's adequacy. The Standardised Root Mean Square Residual (SRMR) values range from .09 to .11 across methods, indicating acceptable fit within the conventional threshold. The Root Mean Square Error of Approximation (RMSEA) values vary more widely, ranging from .14 (Classical) to .22 (Robust), yet all show statistically significant results (p < .001), with confidence intervals provided for each estimate. Notably, the Scaled RMSEA (.15, CI: .13–.17) presents a middle ground, supporting reasonable approximation errors while factoring in distributional adjustments. Collectively, these indices suggest the model demonstrates a fit that warrants cautious acceptance, with stronger support evident under scaled estimation.
Fit Indices
|
Type |
SRMR |
RMSEA |
Lower |
Upper |
RMSEA p |
|
Classical |
.11 |
.14 |
.12 |
.16 |
<.001 |
|
Robust |
.09 |
.22 |
.19 |
.25 |
<.001 |
|
Scaled |
.09 |
.15 |
.13 |
.17 |
<.001 |
Table 8 compares the goodness-of-fit indices between the User Model and the Baseline Model across Scaled and Robust estimations. The Comparative Fit Index (CFI) values indicate strong model fit for the User Model (Scaled = .97; Robust = .91), far surpassing the baseline (.67). Similar trends are observed for the Tucker-Lewis Index (TLI) and the Bentler-Bonett Non-Normed Fit Index (NNFI), where the Scaled values (.97) reflect near-excellent fit and Robust values (.90) meet conventional acceptability thresholds. In contrast, baseline scores around .61 suggest poor fit. Incremental fit indices, including RNI and IFI, echo this pattern, reinforcing the superiority of the User Model. Moreover, the Bentler-Bonett Normed Fit Index (NFI = .96), Bollen’s Relative Fit Index (RFI = .95), and Parsimony Normed Fit Index (PNFI = .82) further validate model adequacy when parsimony is accounted for. These results collectively affirm that the User Model offers a substantially improved representation of the data structure over the baseline.
User Model Versus Baseline Model
|
|
Model |
Scaled |
Robust |
|
Comparative Fit Index (CFI) |
.97 |
.91 |
.67 |
|
Tucker-Lewis Index (TLI) |
.97 |
.90 |
.61 |
|
Bentler-Bonett Non-normed Fit Index (NNFI) |
.97 |
.90 |
.61 |
|
Relative Noncentrality Index (RNI) |
.97 |
.91 |
.67 |
|
Bentler-Bonett Normed Fit Index (NFI) |
.96 |
.87 |
|
|
Bollen’s Relative Fit Index (RFI) |
.95 |
.85 |
|
|
Bollen’s Incremental Fit Index (IFI) |
.97 |
.91 |
|
|
Parsimony Normed Fit Index (PNFI) |
.82 |
.74 |
|
Estimates
Table 9 presents the standardized factor loadings and significance values for the measurement model constructs Exogenous1 and Endogenous1. All observed variables demonstrate strong and statistically significant loadings on their respective latent constructs, indicating solid convergent validity. For Exogenous1, indicators such as BL3 (β = .89, z = 4.17, p < .001), PQ1–PQ3 (β range = .85–.87, all p < .001), and BrA2 (β = .78, z = 4.15, p < .001) stand out with particularly high standardized estimates and strong significance levels, reinforcing their contribution to the latent structure. Similarly, for Endogenous1, the observed variables CL2 through CL4 show robust factor loadings (β range = .75–.98) with highly significant z-values (all p < .001), suggesting strong internal consistency and predictive reliability.
The fixed loading of BA1 and CL1 (set to 1.00) served as reference indicators for their respective latent factors, anchoring scale and identification. The standard errors and confidence intervals fall within acceptable ranges, further supporting the precision of these estimates.
Measurement Model
|
Latent |
Observed |
Estimate |
SE |
Lower |
Upper |
β |
z |
p |
|
Exogenous1 |
BA1 |
1.00 |
0.00 |
1.00 |
1.00 |
0.41 |
|
|
|
|
BA2 |
1.04 |
0.31 |
0.42 |
1.67 |
0.42 |
3.29 |
.001 |
|
|
BA3 |
0.76 |
0.21 |
0.34 |
1.18 |
0.31 |
3.60 |
<.001 |
|
|
BL1 |
1.71 |
0.43 |
0.87 |
2.56 |
0.70 |
3.99 |
<.001 |
|
|
BL2 |
1.83 |
0.43 |
0.98 |
2.69 |
0.75 |
4.21 |
<.001 |
|
|
BL3 |
2.19 |
0.52 |
1.16 |
3.22 |
0.89 |
4.17 |
<.001 |
|
|
PQ1 |
2.07 |
0.46 |
1.17 |
2.98 |
0.85 |
4.52 |
<.001 |
|
|
PQ2 |
2.08 |
0.46 |
1.16 |
3.00 |
0.85 |
4.46 |
<.001 |
|
|
PQ3 |
2.14 |
0.51 |
1.13 |
3.16 |
0.87 |
4.15 |
<.001 |
|
|
BrA1 |
1.74 |
0.43 |
0.89 |
2.59 |
0.71 |
4.04 |
<.001 |
|
|
BrA2 |
1.92 |
0.46 |
1.01 |
2.83 |
0.78 |
4.15 |
<.001 |
|
|
BrA3 |
1.69 |
0.40 |
0.89 |
2.49 |
0.69 |
4.16 |
<.001 |
|
Endogenous1 |
CL1 |
1.00 |
0.00 |
1.00 |
1.00 |
0.46 |
|
|
|
|
CL2 |
1.60 |
0.28 |
1.05 |
2.15 |
0.75 |
5.71 |
<.001 |
|
|
CL3 |
1.89 |
0.34 |
1.22 |
2.57 |
0.88 |
5.49 |
<.001 |
|
|
CL4 |
2.11 |
0.38 |
1.35 |
2.87 |
0.98 |
5.46 |
<.001 |
Table 10 provides key variance and covariance metrics that strengthen the validity of the measurement and structural models. Item-level variances demonstrate acceptable levels of uniqueness, while significant latent variances confirm that both Exogenous1 and Endogenous1 constructs are well-defined. Importantly, the strong, positive covariance between the latent factors underscores the presence of meaningful conceptual linkages worthy of deeper structural exploration.
Table 10
Variances and Covariances
|
Variable 1 |
Variable 2 |
Estimate |
SE |
Lower |
Upper |
β |
z |
p |
|
BA1 |
BA1 |
.83 |
.00 |
.83 |
.83 |
.83 |
|
|
|
BA2 |
BA2 |
.81 |
.00 |
.81 |
.81 |
.81 |
|
|
|
BA3 |
BA3 |
.90 |
.00 |
.90 |
.90 |
.90 |
|
|
|
BL1 |
BL1 |
.50 |
.00 |
.50 |
.50 |
.50 |
|
|
|
BL2 |
BL2 |
.43 |
.00 |
.43 |
.43 |
.43 |
|
|
|
BL3 |
BL3 |
.19 |
.00 |
.19 |
.19 |
.19 |
|
|
|
PQ1 |
PQ1 |
.27 |
.00 |
.27 |
.27 |
.27 |
|
|
|
PQ2 |
PQ2 |
.27 |
.00 |
.27 |
.27 |
.27 |
|
|
|
PQ3 |
PQ3 |
.22 |
.00 |
.22 |
.22 |
.22 |
|
|
|
BrA1 |
BrA1 |
.48 |
.00 |
.48 |
.48 |
.48 |
|
|
|
BrA2 |
BrA2 |
.38 |
.00 |
.38 |
.38 |
.38 |
|
|
|
BrA3 |
BrA3 |
.52 |
.00 |
.52 |
.52 |
.52 |
|
|
|
CL1 |
CL1 |
.78 |
.00 |
.78 |
.78 |
.78 |
|
|
|
CL2 |
CL2 |
.43 |
.00 |
.43 |
.43 |
.43 |
|
|
|
CL3 |
CL3 |
.21 |
.00 |
.21 |
.21 |
.21 |
|
|
|
CL4 |
CL4 |
.02 |
.00 |
.02 |
.02 |
.02 |
|
|
|
Exogenous1 |
Exogenous1 |
.16 |
.07 |
.01 |
.31 |
1.00 |
2.20 |
.028 |
|
Endogenous1 |
Endogenous1 |
.21 |
.07 |
.06 |
.37 |
1.0000 |
2.77 |
.006 |
|
Exogenous1 |
Endogenous1 |
.15 |
.05 |
.05 |
.25 |
.7988 |
3.04 |
.002 |
Table 11 displays the estimated thresholds for ordinal indicators with associated confidence intervals, standard errors, and significance levels. Most thresholds are statistically significant and demonstrate clear separation between response categories, strengthening the measurement precision of latent constructs. A few non-significant thresholds suggest potential overlaps in category interpretation and merit further evaluation in scale refinement.
Thresholds: 95% Confidence Intervals
95% Confidence Intervals
|
Variable |
Step |
Thresholds |
SE |
Lower |
Upper |
z |
p |
|
BA1 |
t1 |
-1.57 |
0.24 |
-2.05 |
-1.09 |
-6.43 |
<.001 |
|
BA1 |
t2 |
-0.99 |
0.18 |
-1.35 |
-0.63 |
-5.45 |
<.001 |
|
BA1 |
t3 |
0.01 |
0.15 |
-0.28 |
0.31 |
0.12 |
.905 |
|
BA2 |
t1 |
-1.572 |
0.24 |
-2.05 |
-1.09 |
-6.43 |
<.001 |
|
BA2 |
t2 |
-1.12 |
0.19 |
-1.50 |
-0.74 |
-5.83 |
<.001 |
|
BA2 |
t3 |
-0.64 |
0.16 |
-0.96 |
-0.31 |
-3.90 |
<.001 |
|
BA2 |
t4 |
0.35 |
0.15 |
0.04 |
0.65 |
2.26 |
.023 |
|
BA3 |
t1 |
-1.36 |
0.21 |
-1.78 |
-0.93 |
-6.29 |
<.001 |
|
BA3 |
t2 |
-0.93 |
0.17 |
-1.29 |
-0.58 |
-5.24 |
<.001 |
|
BA3 |
t3 |
-0.55 |
0.16 |
-0.86 |
-0.23 |
-3.44 |
<.001 |
|
BA3 |
t4 |
0.43 |
0.15 |
0.12 |
0.73 |
2.74 |
.006 |
|
BL1 |
t1 |
-0.99 |
0.18 |
-1.35 |
-0.63 |
-5.45 |
<.001 |
|
BL1 |
t2 |
-0.09 |
0.15 |
-0.38 |
0.20 |
-0.59 |
.550 |
|
BL1 |
t3 |
0.83 |
0.17 |
0.49 |
1.17 |
4.81 |
<.001 |
|
BL1 |
t4 |
1.57 |
0.24 |
1.09 |
2.05 |
6.43 |
<.001 |
|
BL2 |
t1 |
-1.12 |
0.19 |
-1.50 |
-0.74 |
-5.83 |
<.001 |
|
BL2 |
t2 |
-0.43 |
0.15 |
-0.73 |
-0.12 |
-2.74 |
.006 |
|
BL2 |
t3 |
0.68 |
0.16 |
0.36 |
1.01 |
4.13 |
<.001 |
|
Variable |
Step |
Thresholds |
SE |
95% Confidence Intervals |
z |
p |
|
|
Lower |
Upper |
||||||
|
BL2 |
t4 |
1.89 |
0.30 |
1.29 |
2.49 |
6.16 |
<.001 |
|
BL3 |
t1 |
-1.71 |
0.26 |
-2.23 |
-1.18 |
-6.38 |
<.001 |
|
BL3 |
t2 |
-1.36 |
0.21 |
-1.78 |
-0.93 |
-6.29 |
<.001 |
|
BL3 |
t3 |
-0.16 |
0.15 |
-0.46 |
0.13 |
-1.07 |
.282 |
|
BL3 |
t4 |
1.19 |
0.19 |
0.80 |
1.58 |
6.01 |
<.001 |
|
PQ1 |
t1 |
-1.71 |
0.26 |
-2.23 |
-1.18 |
-6.38 |
<.001 |
|
PQ1 |
t2 |
-1.27 |
0.20 |
-1.67 |
-0.86 |
-6.16 |
<.001 |
|
PQ1 |
t3 |
-0.20 |
0.15 |
-0.50 |
0.09 |
-1.31 |
.189 |
|
PQ1 |
t4 |
1.12 |
0.19 |
0.74 |
1.50 |
5.83 |
<.001 |
|
PQ2 |
t1 |
-2.18 |
0.39 |
-2.95 |
-1.41 |
-5.54 |
<.001 |
|
PQ2 |
t2 |
-1.36 |
0.21 |
-1.78 |
-0.93 |
-6.29 |
<.001 |
|
PQ2 |
t3 |
0.05 |
0.15 |
-0.24 |
0.35 |
0.35 |
.720 |
|
PQ2 |
t4 |
0.99 |
0.18 |
0.63 |
1.35 |
5.45 |
<.001 |
|
PQ3 |
t1 |
-1.89 |
0.30 |
-2.49 |
-1.29 |
-6.16 |
<.001 |
|
PQ3 |
t2 |
-1.27 |
0.20 |
-1.67 |
-0.86 |
-6.16 |
<.001 |
|
PQ3 |
t3 |
0.05 |
0.15 |
-0.24 |
0.35 |
0.35 |
.720 |
|
PQ3 |
t4 |
1.45 |
0.22 |
1.01 |
1.90 |
6.39 |
<.001 |
|
BrA1 |
t1 |
-2.18 |
0.39 |
-2.95 |
-1.41 |
-5.54 |
<.001 |
|
BrA1 |
t2 |
-1.12 |
0.19 |
-1.50 |
-0.74 |
-5.83 |
<.001 |
|
BrA1 |
t3 |
-0.09 |
0.15 |
-0.38 |
0.20 |
-0.59 |
.550 |
|
BrA1 |
t4 |
1.36 |
0.21 |
0.93 |
1.78 |
6.29 |
<.001 |
|
BrA2 |
t1 |
-1.89 |
0.30 |
-2.49 |
-1.29 |
-6.16 |
<.001 |
|
BrA2 |
t2 |
-1.05 |
0.18 |
-1.42 |
-0.69 |
-5.64 |
<.001 |
|
BrA2 |
t3 |
0.27 |
0.15 |
-0.02 |
0.57 |
1.79 |
.073 |
Table 12 reports threshold estimates for BrA and CL items, offering insights into the ordinal structure of latent traits. Most thresholds are statistically significant and well ordered, indicating effective discrimination between response categories. However, select intermediate thresholds (e.g., CL2.t3, CL3.t3, CL4.t3) yielded non-significant results, which may suggest response overlap or measurement ambiguity.
Results
This model was tested by Structural Equation Modelling (SEM) between the dimensions of brand equity and customer life cycle within the given population. The model indicated a good fit overall, with a scaled Comparative Fit Index (CFI) of .97 and Tucker-Lewis Index (TLI) of .97, reflecting strong model relative fit. However, the Root Mean Square of Approximation (RMSEA) (.15) and Standard Root Mean Square Residual (SRMR) (.09) slightly exceeded the cutoff points, but the model could still yield empirical insight into the construct variables.
The model fit showed that all the observed variables strongly loaded onto their latent variables. Factor loadings were moderate to high (β = .31 to .89, p < .001); thus, the constructs that are related to the measurement of Brand Awareness, Brand Loyalty, Perceived Quality, Brand Association and Customer Loyalty are key contributors to the reliability and validity of the items.
In the model, the latent construct of brand equity dimensions (Exogenous1) had a very strong and statistically significant positive influence on customer loyalty (Endogenous1) (β = .79, p = .002). This is an important indication of the vital contributions of brand equity elements in fostering loyalty. The estimates of variances of all latent or observed variables were positive and significant, indicating the stability of the model.
Thresholds
|
BrA2 |
t4 |
1.57 |
0.24 |
1.09 |
2.05 |
6.43 |
<.001 |
|
BrA3 |
t1 |
-1.27 |
0.20 |
-1.67 |
-0.86 |
-6.16 |
<.001 |
|
BrA3 |
t2 |
-0.39 |
0.15 |
-0.69 |
-0.08 |
-2.50 |
.012 |
|
BrA3 |
t3 |
0.73 |
0.16 |
0.40 |
1.06 |
4.36 |
<.001 |
|
BrA3 |
t4 |
1.27 |
0.20 |
0.86 |
1.67 |
6.16 |
<.001 |
|
CL1 |
t1 |
-1.57 |
0.24 |
-2.05 |
-1.09 |
-6.43 |
<.001 |
|
CL1 |
t2 |
-0.73 |
0.16 |
-1.06 |
-0.40 |
-4.36 |
<.001 |
|
CL1 |
t3 |
0.43 |
0.15 |
0.12 |
0.73 |
2.74 |
.006 |
|
CL1 |
t4 |
1.57 |
0.24 |
1.09 |
2.05 |
6.43 |
<.001 |
|
CL2 |
t1 |
-1.57 |
0.24 |
-2.05 |
-1.09 |
-6.43 |
<.001 |
|
CL2 |
t2 |
-1.12 |
0.19 |
-1.50 |
-0.74 |
-5.83 |
<.001 |
|
CL2 |
t3 |
0.20 |
0.15 |
-0.09 |
0.50 |
1.31 |
.189 |
|
CL2 |
t4 |
1.57 |
0.24 |
1.09 |
2.05 |
6.43 |
<.001 |
|
CL3 |
t1 |
-1.89 |
0.30 |
-2.49 |
-1.29 |
-6.16 |
<.001 |
|
CL3 |
t2 |
-1.19 |
0.19 |
-1.58 |
-0.80 |
-6.01 |
<.001 |
|
CL3 |
t3 |
-0.20 |
0.15 |
-0.50 |
0.09 |
-1.31 |
.189 |
|
CL3 |
t4 |
1.12 |
0.19 |
0.74 |
1.50 |
5.83 |
<.001 |
|
CL4 |
t1 |
-1.89 |
0.30 |
-2.49 |
-1.29 |
-6.16 |
<.001 |
|
CL4 |
t2 |
-1.27 |
0.20 |
-1.67 |
-0.86 |
-6.16 |
<.001 |
|
CL4 |
t3 |
-0.12 |
0.15 |
-0.42 |
0.17 |
-0.83 |
.403 |
|
CL4 |
t4 |
0.88 |
0.17 |
0.54 |
1.22 |
5.03 |
<.001 |
Note. BA—Brand Awareness, BL—Brand Loyalty, PQ---Perceived Quality, BRA---Brand Awareness, CL---Customer Lifecycle.
Threshold examination for the ordered categorical items showed that meaningful and increasing thresholds; therefore, the use of ordered categorical modelling procedures was appropriate. The only issue found was a warning about a singular variance-covariance matrix, which was trivial and would not significantly influence the results.
Discussion
This study’s results affirm the importance of the impact of the brand equity dimensions (brand awareness, brand loyalty, perceived quality, brand association) as contributors to the development of the customer life cycle. These findings are consistent with previous research highlighting the crucial role of brand management in fostering long-term customer relationships. Furthermore, the validation of the measurement model makes a significant effort to understand how individual brand components interact to shape consumer responses. Nevertheless, despite the strong comparative fit of the model, the slightly inflated residual indices indicate avenues for model-tuning in future research.
The good and significant positive relationship between Perceived Quality (PQ) and Brand Loyalty (BL) extracted at r = .78, exhibits how the quality of a product helps to generate brand loyalty. This is even more true in customers' time and the startup environment. Many start-ups work in markets where brand makes a big difference for long-term viability. The literature states that perception of quality is a key factor in brand loyalty and has an impact on consumer behaviour and retention in many sectors (Erdoğmuş & Büdeyri‐Turan, 2012; Mensah et al., 2022; Park & Namkung, 2022). The finding that perceived quality influences brand loyalty aligns with the customer life-cycle theory, to the extent that initial evaluations have a significant impact on long-term loyalty and future consumer involvement (Francioni et al., 2022; Ha et al., 2011).
During the early parts of the customer lifecycle, it is all about awareness and trial. A small initial population of emerging new technology firms is intended to establish a favourable image for potential users (Oyedele et al., 2024), through marketing activities that showcase the product's quality, which in this industry automatically creates a prosocial process. According to the evidence, the perception of quality as part of brand attitudes leads to long-term loyalty, particularly among initial purchase customers (Arunachalam et al., 2024; Ghimire & Karki, 2022; Oyedele & Fredrick, 2023). This is important for startup businesses that deend on word-of-mouth and referrals to grow a customer base, so ensuring that the product quality at least meets consumer expectations is important.
Start-ups have the unique benefit of agility and can quickly innovate and pivot their offering in response to customer feedback. This flexibility can lead to an increased perception of quality and, eventually, brand loyalty (Azzahra et al., 2023). As Arunachalam et al. (2024) reported, perceived quality enhancements not only enhance brand loyalty but also serve as an antecedent to brand equity, which is crucial for startups as they transition from the introductory phase into a state of stability. It is this vicious cycle that explains why startups should consistently strive to deliver high-quality products.
Additionally, the impact of perceived quality is significantly amplified through marketing communication channels, particularly social media. The impact of social media on brand image and perceived quality makes the original brand loyal (Susanto & Ruswanti, 2024; Schivinski & Dąbrowski, 2015). Startups that successfully utilize social media marketing to build a strong brand value and foster strong relationships with their target audience can retain customers throughout their life cycle (Mostafa & Kasamani, 2020).
The identified relationship between BA and CL has fundamental implications, which can be particularly important for startups dealing with the customer lifecycle. A strong association between BA and CL is straightforward to establish; higher levels of BA will lead to greater customer loyalty, as consumers are naturally predisposed to being loyal to brands they recognize and understand (Kunle et al., 2020; Romaniuk et al., 2017). The influence of BA may be strengthened in startups, where brand reputation cannot be separated from many aspects of an organisation's core business. Startups are initially faced with a relatively limited market rentability and low customer acceptance; thus, it becomes very important to emphasise brand awareness.
In addition to that, the consumer journey, in the context of customer lifecycle, is dependent on brand awareness as a precursor to brand loyalty and engagement (Tania et al., 2023). It has been reported through research that consumers who have awareness of a brand’s existence are far more likely to keep that brand in mind at purchase time (Tania et al., 2023). This result highlights the role of strategic marketing in efforts to raise BA through social media and community engagement, two places where startups are likely to be active (Algharabat et al., 2020; Ha, 2004). With the improved brand awareness, the startup makes more enlightened and engaged customers who remain loyal for a long time.
Furthermore, customer lifecycle in the context of the startup reveals the significance of BA even more. Start-ups frequently have difficulty creating customer knowledge initially; therefore, greater attention to brand building is worthwhile to help achieve the various tasks of the customer life cycle, that is, developing awareness, consideration, and finally retention (Huang & Sarigöllü, 2012; Wang et al., 2016). For instance, in the context of startup development, it makes sense to focus on customer retention, as loyal customers are more likely to provide word-of-mouth referrals, which are crucial in new customer acquisition (Bing et al., 2024). This symbolic relationship suggests that investment in BA not only reinforces CL but also accelerates the spread of the building process of wider brand equity among startups.
Another finding reveals a positive correlation (.71) between BrA2 and BrA3 and overall brand equity, which reflects the importance of building strong and favourable associations to create loyalty and connect with customers. This idea becomes even more important when examining the consumer life cycle, especially at the startup level, where how you interact with your customers, how they perceive your brand, and how much they love it are all determining factors in your future.
It’s the awareness stage in the customer life cycle when startups need to properly introduce their brand fundamentals and unique selling propositions to the world market. Brand associations developed at this time are crucial, as they set the basis for how consumers relate to and perceive the brand. Aaker’s view, based on research, indicates that brand equity depends primarily on strong, positive, and distinctive associations with customers (Sontaite-Petkeviciene, 2020). Companies can differentiate themselves by building these relationships, and in competitive markets, such influence will help make the difference between being in or out of mind, making it less likely that potential customers will forget the company.
Favourable brand associations when customers move on to the consideration stage make it possible to make a deeper evaluation of the brand than the competitors or close substitutes. Positive associations that customers hold towards a brand have a strong impact on how they perceive and value that brand, characteristics that are crucial during the evaluation phase. It is at this stage that successful brand communication is crucial, with its ability to build emotional connections (storytelling and branding consistency) potentially consolidating a memory structure (Schivinski & Dąbrowski, 2015). Startups that leverage those associations effectively see their conversion rates increase, as people are more likely to choose brands they trust and feel good about. When it comes to the purchasing level, emotions developed as a result of brand associations are crucial in purchase making (Showrav & Nitu, 2018). In the case that brands have a fit between the social responsibility and the identity or values that the customer has, the customers are more likely to remember and select these brands, and this leads to loyalty. Empirical studies have shown that consumers are willing to pay a higher price for a brand they associate with or that embodies their values, highlighting the importance of brand associations in transactional settings (Kumar et al., 2013). During the loyalty/retention phase, the influence of brand associations further strengthens. Customers endowed with favourable associations will begin to form an emotional connection to the brand, which in turn will increase their loyalty (Dananjoyo & Udin, 2023). The necessity of this emotional bond lies in its ability to keep the customer involved and prevent customer churn. This is supported by studies, which state that loyalty largely emanates from the emotional bond produced through strong brand associations resulting from previous interactions (Yoon & Oh, 2016). Developing that stage through personal interactions and positive experiences is crucial for start-ups to retain their users.
During the advocacy stage of the customer life cycle, customers who are now turned brand advocates will create positive word-of-mouth on the brand based on their positive references and experiences (Mirmehdi, 2023). Startups can greatly benefit from these supporters, as happy customers who feel good about their interactions with a brand are often quick to share this positive experience with others, which in turn drives new customer acquisition through word-of-mouth marketing. It is worth highlighting that advocacy tends to be influenced by the strength of the emotional ties formed along the customer journey, and to this end, the significance of strong and positive brand connections (Hasbiah, 2023).
Another finding reveals that the association of brand loyalty with brand associations is .56, indicating that stronger brand associations lead to a higher level of brand loyalty among the customers. This correlation is especially relevant when examining the customer life cycle, as well as the related issues that startups face.
In the customer life cycle, brand associations influence customer perception and experience through the journey of awareness, consideration, and loyalty. Powerful associations with a brand can influence consumer preferences and differentiate it from its competitors. Establishing positive attitudes can then result in increased loyalty levels, where customers become more familiar and emotionally attached to a brand (Arunachalam et al., 2024; Thảo & Hạnh, 2016). Young startups must build strong brand associations, even in their early life cycles. Because startups typically begin with a relatively low level of brand awareness, creating differential relationships and relevant brand associations can facilitate their progression through the phases of the life cycle, particularly from trial to repurchase (Bairrada et al., 2019).
Startups can develop brand associations using multiple approaches. Startups can build deep emotional connections with customers through targeted marketing that celebrates their unique brand values, mission statements, and customer quotes. Positive service experiences and interactive customer communications can strengthen brand associations and improve perceived value, which in turn increases loyalty (Saleem et al., 2015). Especially in the realm of social media marketing, emotionally appealing content is likely to enhance brand associations and, thus, brand loyalty across the customer journey (Mostafa & Kasamani, 2020).
As startups evolve, nurturing these brand connections needs to be practised on an ongoing basis. Interacting with clients by using consistent messages, contributing to their experience by offering high-quality products or services, often helps strengthen these relationships and even grows loyalty rates among clients (Maura et al., 2022). It further underscores the fact that customer-centric strategies not only aid in the development of brand loyalty but also pave the way for the creation of a sustainable brand image that will enhance brand equity in the long term.
For startups, it is also key to know how to develop brand associations across various consumer segments. It has been observed that younger generations will positively respond to a brand that recognises their preferences and connects it with a common identity (Sasmita & Suki, 2015). Therefore, customising brand associations based on demographic cues can increase overall brand loyalty, as such demographic-based associations help customers form a personal connection with the brand.
Lastly, given that the correlation of 0.562 between brand loyalty and brand associations shows that the management of these associations must be properly monitored, it is imperative as part of the customer lifecycle strategy, especially by startups. Startups can not only increase customer loyalty but also navigate the “customer life cycle” effectively by nurturing strong brand associations through thoughtful engagement strategies, along with reliable product or service delivery.
Recommendations
These results suggest that startup companies should emphasize improving product quality across a range of attributes, which should positively reinforce brand associations and maximize the development and maintenance of loyalty among their customers. Consumer feedback can be gathered through comprehensive quality supervision to identify potential areas for improvement. Additionally, startups must invest in building brand narratives and associations that their audience can relate to, perhaps by using social media and other digital tools for engagement. The strong emotional alignment with customers is known to establish a competitive advantage and long-term loyalty to startups, which are created through brand-building activities.
Theoretical Implications
The theoretical underpinnings of this study are based on two important theories: Keller's Brand Equity Theory and the Customer Life Cycle Theory. According to Keller’s Brand Equity Theory, brand equity results largely from consumer perceptions based on brand awareness, associations, loyalty, and perceived quality (Chung & Park, 2015). According to this theory, there's a direct relationship between stronger brand associations and higher brand loyalty. This research therefore supports the role of brand associations in developing loyalty by emphasising that the more solid the brand image, the more successful the brand is in being kept in the customers' minds, especially in a competitive environment.
In start-ups, the application of Keller’s model is necessary, as it explores the ways brand development of an emerging company gives a competitive advantage. Startups typically lack established brands and associated loyalty, which is why creating strong brand associations is a critical marketing strategy. By creating their brand narratives and experiences, startups are successful in the minds of potential customers during the customer life cycle stages - awareness, consideration, and loyalty (Kuenzel & Halliday, 2010). The conclusion is that startups must move early on and ensure that the associations made with their startup are positive and align with their target group.
The Customer Life Cycle Theory supplements Keller's model by depicting the development of customer-brand relationships across time. According to this theory, customers' interactions with the brand vary as they progress through stages of awareness, engagement, and loyalty (Alatyat et al., 2023). In the specific case of this study, strong brand associations are not only important at the time of initial awareness, but they also continue to be crucial in building loyalty through post-awareness engagement. For startups, this implies that as they build their brand, they should engage consumers with value-adding experiences and constant reminders that can, to some extent, gratuitously reinforce positive inferences and loyalties (Oyenuga et al., 2019; Raut et al., 2019).
In any case, the results also underscore the complex dynamics of brand identification and loyalty in the customer life cycle. When consumers form a brand relationship, their psychological connection to the brand deepens, potentially generating loyalty and advocacy, which is crucial for start-ups to establish a strong customer base through referrals and repeat business (Kandampully et al., 2015; Taylor et al., 2007). Therefore, by gaining insights into the theoretical constructs of BE and CLC, start-ups will be able to develop implementable strategies to build brand resonance and loyalty over time.
In essence, the theoretical implications of this research suggest that Keller’s Brand Equity Theory and the Customer Life Cycle Theory have the potential to contribute knowledge for the development of brand loyalty via strong brand associations. For startups, these guidelines are crucial in directing their branding efforts to develop a robust and sustainable relationship with their clients, while also remaining flexible enough to progress through the customer life cycle.
Practical Implications
From an applied perspective, based on the connections found between brand loyalty and brand associations, a few strategic paths are highlighted for managers, particularly in the startup context. Primarily, this research points to the need to "endow" strong brand associations to influence brand loyalty. However, for startups, which often experience a scarcity of resources and low market visibility, crafting powerful brand stories that reflect audience interest can significantly define consumer perceptions (Zhang & Ravishankar, 2023). Conceptually endorsing brand strategies that clarify and articulate distinctive value propositions, and by which new ventures can access favourable brand associations from the very inception of their operational life, and then create sustained associations.
The findings also support socially active digital marketing platforms and social media as vehicles for increasing customer engagement. Social media facilitates easier connections between brands and consumers, fostering strong consumer loyalty (Cahyadi & Tunjungsari, 2023). Organisations, especially start-ups, need to utilise these platforms to not only share interesting content consistent with their branding but also develop relationships with customers in the process (Omale et al., 2024). This interaction is key to ensuring positive brand associations, which are essential if they want customer to stick with their brand long term.
In addition, customer satisfaction is all the more reason for a startup to match its product quality and service with the expectations of customers (Oyedele & Fredrick, 2023). For instance, as emphasised by Waebuesar et al (2022), brand loyalty is predominantly affected by customer satisfaction. Therefore, to ensure that customer experiences are utilized to the maximum, Startups need to have stringent quality control when it comes to their products and offer the best services to customers, thereby generating a strong brand identity. These are the strategies not only to retain those customers but also to make them advocates, thereby growing organically through word-of-mouth recommendations (Oyedele & Opeyemi, 2024). Razzan and Sigit (2023) also indicated that service quality, brand image, and customer satisfaction significantly affect customer loyalty. Startups need to be in the driver's seat when it comes to the perception of their brand and its brand promise as a credible player in the market. By being beloved brands, startups can eliminate the uncertainty and friction that often accompany purchasing a product for the first time, and can ensure loyalty from these new customers (Kabbara & Hagen, 2023).
Limitations and Conclusion
Although the present study has made a significant contribution, it also has limitations that we should recognise and acknowledge. There are several limitations to the sample size and demographics when attempting to generalize results across different industries or types of consumers. Further studies should attempt to use a larger sample size to confirm these findings across different contexts. Moreover, the research is mainly quantitative, which does not address the intricate nature of consumer perception and their emotional response. Future research would also benefit from a qualitative research approach to gain a deeper understanding of consumers' attitudes and behaviours toward brand associations and loyalty. Finally, the study does not consider possible moderating variables, such as market developments or competitive maneuvers, that might impact brand perception and moderation dynamics.
References
Aaker, D. A. (1991). Managing brand equity: Capitalizing on the value of a brand name. The Free Press.
Abdullah, A., & Siraj, S. (2016). Brand equity through customer engagement in social media: a critical review. IOSR Journal of Business and Management, 18(08), 38–46. https://doi.org/10.9790/487x-1808023846
Alam, M. N., Turi, J. A., Bhuiyan, A. B., Kharusi, S. A., Oyenuga, M., Zulkifli, N., & Iqbal, J. (2024b). Factors influencing intention for reusing virtual reality (VR) at theme parks: the mediating role of visitors' satisfaction. Cogent Social Sciences, 10(1). https://doi.org/10.1080/23311886.2023.2298898
Alatyat, Z., Atiat, H., Al-Qatawneh, M., Alrahamneh, N., Alrahamneh, H., Alzyadat, M., … & Abu-Jalil, M. (2023). The impact of branding in building and enhancing customer loyalty for banking services: an applied study of commercial bank customers in Jordan. International Journal of Professional Business Review, 8(4), e01138. https://doi.org/10.26668/businessreview/2023.v8i4.1138
Algharabat, R., Rana, N., Alalwan, A., Baabdullah, A., & Gupta, A. (2020). Investigating the antecedents of customer brand engagement and consumer-based brand equity in social media. Journal of Retailing and Consumer Services, 53, 101767. https://doi.org/10.1016/j.jretconser.2019.01.016
Anselmsson, J., Burt, S., & Tunca, B. (2017). An integrated retailer image and brand equity framework: re-examining, extending, and restructuring retailer brand equity. Journal of Retailing and Consumer Services, 38, 194–203. https://doi.org/10.1016/j.jretconser.2017.06.007
Arunachalam, T., Sivakumar, M., & Raveendran, A. (2024). Young consumers' insights on brand association, brand awareness, perceived quality, brand image, brand loyalty and brand equity. 428–436. https://doi.org/10.5937/imcsm24043a
Avdımıotıs, S., & Poulaki, I. (2019). Airbnb impact and regulation issues through the destination life cycle concept. International Journal of Culture Tourism and Hospitality Research, 13(4), 458–472. https://doi.org/10.1108/ijcthr-03-2019-0044
Azzahra, N., Febrian, A., Pratama, D., Na’im, A., & Mawardi, M. (2023). The effect of perceived quality, brand awareness, and brand association in building brand loyalty among young consumers. https://doi.org/10.4108/eai.13-9-2023.2341053
Bairrada, C., Coelho, A., & Lizanets, V. (2019). The impact of brand personality on consumer behavior: the role of brand love. Journal of Fashion Marketing and Management, 23(1), 30–47. https://doi.org/10.1108/jfmm-07-2018-0091
Bambauer-Sachse, S., & Mangold, S. (2011). Brand equity dilution through negative online word-of-mouth communication. Journal of Retailing and Consumer Services, 18(1), 38–45. https://doi.org/10.1016/j.jretconser.2010.09.003
Barwitz, N. & Maas, P. (2018). Understanding the omnichannel customer journey: determinants of interaction choice. Journal of Interactive Marketing, 43(1), 116–133. https://doi.org/10.1016/j.intmar.2018.02.001
Bing, G., Mughairi, B., Karim, A., & Karim, A. (2024). Study on the importance of brand loyalty for customer retention for consumer durable products: new era viewpoint. International Journal of Academic Research in Business and Social Sciences, 14(1). https://doi.org/10.6007/ijarbss/v14-i1/20464
Brakus, J. J., Schmitt, B. H., & Zarantonello, L. (2009). Brand experience: What is it? How is it measured? Does it affect loyalty?. Journal of Marketing, 73(3), 52–68. https://doi.org/10.1509/jmkg.73.3.52
Boukis, A., & Christodoulides, G. (2018). Investigating key antecedents and outcomes of employee‐based brand equity. European Management Review, 17(1), 41–55. https://doi.org/10.1111/emre.12327
Cahyadi, F. & Tunjungsari, H. (2023). The influence of brand interactivity, involvement, social media cbe on loyalty: trust as a mediation variable. IJAEB, 1(3), 1749–1757. https://doi.org/10.24912/ijaeb.v1i3.1749-1757
Cambra‐Fierro, J., Melero‐Polo, I., & Sesé, F. (2018). Customer value co-creation over the relationship life cycle. Journal of Service Theory and Practice, 28(3), 336–355. https://doi.org/10.1108/jstp-01-2017-0009
Cerna, N., & Schneider, S. (2023). The mediating effect of brand equity on the relationship between marketing mix and customer engagement for online food delivery services. International Journal of Research Publications, 132(1). https://doi.org/10.47119/ijrp1001321920235456
Chung, S., & Park, J. (2015). The influence of brand personality and relative brand identification on brand loyalty in the European mobile phone market. Canadian Journal of Administrative Sciences / Revue Canadienne Des Sciences De L Administration, 34(1), 47–62. https://doi.org/10.1002/cjas.1321
Dada, M. (2021). Impact of brand association, brand image &brand loyalty on brand equity. Journal of Marketing Strategies, 3(1), 29–43. https://doi.org/10.52633/jms.v3i1.33
Dananjoyo, R., & Udin, U. (2023). The effect of sustainable brand equity on customer satisfaction and customer loyalty using customer trust as mediation variable. International Journal of Sustainable Development and Planning, 18(7), 2281–2291. https://doi.org/10.18280/ijsdp.180733
Davcik, N. (2013). An empirical investigation of brand equity: drivers and their consequences. British Food Journal, 115(9), 1342–1360. https://doi.org/10.1108/bfj-01-2012-0005
Ebeid, A. Y. (2014). Distribution intensity, advertising, monetary promotion, and customer-based brand equity: an applied study in Egypt. International Journal of Marketing Studies, 6(4). https://doi.org/10.5539/ijms.v6n4p113
Erdem, T., & Swait́, J. (2016). The information-economics perspective on brand equity. Foundations and Trends® in Marketing, 10(1), 1–59. https://doi.org/10.1561/1700000041
Erdoğmuş, İ., & Büdeyri‐Turan, I. (2012). The role of personality congruence, perceived quality and prestige on ready‐to‐wear brand loyalty. Journal of Fashion Marketing and Management, 16(4), 399–417. https://doi.org/10.1108/13612021211265818
Francioni, B., Curina, I., Hegner, S., Cioppi, M., & Pencarelli, T. (2022). Managing brand equity in the brewing sector. British Food Journal, 124(13), 501–519. https://doi.org/10.1108/bfj-10-2021-1160
Ghimire, M., & Karki, D. (2022). Brand loyalty among mobile users. NCC Journal, 7(1), 1–14. https://doi.org/10.3126/nccj.v7i1.58612
Hakala, U., Svensson, J., & Vincze, Z. (2012). Consumer‐based brand equity and top‐of‐mind awareness: a cross‐country analysis. Journal of Product & Brand Management, 21(6), 439–451. https://doi.org/10.1108/10610421211264928
Ha, H. (2004). Factors influencing consumer perceptions of brand trust online. Journal of Product & Brand Management, 13(5), 329–342. https://doi.org/10.1108/10610420410554412
Ha, H., John, J., Janda, S., & Muthaly, S. (2011). The effects of advertising spending on brand loyalty in services. European Journal of Marketing, 45(4), 673–691. https://doi.org/10.1108/03090561111111389
Hasbiah, S. (2023). Exploring the role of brand equity on customer satisfaction and brand loyalty: a case study of Browcyl's signature Makassar snacks. Economics and Business Journal (Ecbis), 2(1), 89–98. https://doi.org/10.47353/ecbis.v2i1.109
Huang, R., & Sarigöllü, E. (2012). How brand awareness relates to market outcome, brand equity, and the marketing mix. Journal of Business Research, 65(1), 92–99. https://doi.org/10.1016/j.jbusres.2011.02.003
Jiménez‐Zarco, A., Méndez-Aparicio, M., & Izquierdo–Yusta, A. (2023). Can the vital cycle explain the circular consumer journey? A historical analysis of the relationship of the Spanish Generation X with emblematic brands. Journal of Historical Research in Marketing, 16(1), 3–24. https://doi.org/10.1108/jhrm-07-2023-0035
Kabbara, D., & Hagen, B. (2023). A life cycle view on unicorn start-ups: drivers of long-term high-growth. Journal of Small Business and Enterprise Development, 30(6), 1210–1240. https://doi.org/10.1108/jsbed-02-2023-0077
Kandampully, J., Zhang, T., & Bilgihan, A. (2015). Customer loyalty: a review and future directions with a special focus on the hospitality industry. International Journal of Contemporary Hospitality Management, 27(3), 379–414. https://doi.org/10.1108/ijchm-03-2014-0151
Kataria, S., & Saini, V. (2019). The mediating impact of customer satisfaction in relation of brand equity and brand loyalty. South Asian Journal of Business Studies, 9(1), 62–87. https://doi.org/10.1108/sajbs-03-2019-0046
Keller, K. L. (1993). Conceptualizing, measuring, and managing customer-based brand equity. Journal of Marketing, 57(1), 1–22. http://www.jstor.org/stable/1252054
Kuenzel, S., & Halliday, S. (2010). The chain of effects from reputation and brand personality congruence to brand loyalty: the role of brand identification. Journal of Targeting Measurement and Analysis for Marketing, 18(3-4), 167–176. https://doi.org/10.1057/jt.2010.15
Kumar, R., Dash, S., & Purwar, P. (2013). The nature and antecedents of brand equity and its dimensions. Marketing Intelligence & Planning, 31(2), 141–159. https://doi.org/10.1108/02634501311312044
Kunle, L., Ganiyu, R., & Nkechi, P. (2020). An investigation of brand equity dimensions and customer retention: a perspective of postpaid telecom subscribers in Lagos State, Nigeria. International Journal of Management and Economics, 56(4), 339–350. https://doi.org/10.2478/ijme-2020-0029
Li, Z. (2022). How organizations create employee-based brand equity: mediating effects of employee empowerment. Frontiers in Psychology, 13. https://doi.org/10.3389/fpsyg.2022.862678
Ma, C., Liu, Q., Cao, R., Dai, Z., & Guo, F. (2024). Supply chain finance and firm strategic change: A firm life cycle perspective. Economics and Politics, 36(3), 1604–1632. https://doi.org/10.1111/ecpo.12302
Marcus, G. O., Oyenuga, M. O., & Ahungwa A. I(2020). Effects of sales promotion on consumer buying behaviour of food seasoning among Nigerian households: A case study of Nestle Maggi Naijapot. Budapest International Research and Critics Institute Journal (BIRCIJournal), 3(1),134–139 https://doi.org/10.33258/birci.v3i1.724
Maura, N., Wibowo, J., Candraningrat, C., & Fianto, A. (2022). Analysis the effect of brand experience and brand innovation on brand loyalty with brand trust as a mediation variable. Die Jurnal Ilmu Ekonomi Dan Manajemen, 13(2), 122–132. https://doi.org/10.30996/die.v13i2.7293
Mensah, J., Oppong, P., & Addae, M. (2022). Effect of packaging on perceived quality and brand loyalty: the mediating role of brand association in the over-the-counter market. Open Journal of Business and Management, 10(01), 297–313. https://doi.org/10.4236/ojbm.2022.101018
Miller, K., McAdam, M., & McAdam, R. (2014). The changing university business model: a stakeholder perspective. R&D Management, 44(3), 265–287. https://doi.org/10.1111/radm.12064
Mirmehdi, S. (2023). Investigating the effect of drivers of customer equity on continuance use intention of branded apps. International Journal of E-Business Research, 19(1), 1–16. https://doi.org/10.4018/ijebr.323211
Mostafa, R., & Kasamani, T. (2020). Brand experience and brand loyalty: Is it a matter of emotions?. Asia Pacific Journal of Marketing and Logistics, 33(4), 1033–1051. https://doi.org/10.1108/apjml-11-2019-0669
Omale, S. A., Yusuf, S. O., Oyenuga, M. O., Ikemefuna, M., Ojo, S. S., & Momodu, I. D. (2024). Organizational learning in the post-COVID-19 era: A prerequisite for stakeholder satisfactions. Twist 19(3), 265–272. https://twistjournal.net/twist/article/view/339
Oyedele, M. O., & Fredrick, E. (2023). Managing product features and customer satisfaction via product development, product branding, and product packaging: Evidence from CWAY table water. Marketing and Branding Research, 10(1), 28–44. https://doi.org/10.32038/mbr.2023.10.01.03
Oyedele, M. O., & Opeyemi, L. (2024). Using Marketing Mix Strategies to Influence Customer Patronage in an Indigenous Restaurant. ROWTER Journal. https://doi.org/10.33258/rowter.v3i1.1052
Oyedele, M. O., Sunday, A. O., & Abuh, A. I. (2024) Fostering technological-enhanced training and development for business survival and performance in the new normal. Journal of Propulsion Technology 45(3), 1858–1869. https://propulsiontechjournal.com/index.php/journal/article/view/7479
Oyenuga, M. O., Ahungwa, A. I., & Onoja, E. (2021). Effect of brand equity on consumer behaviour among students of Veritas University, Nigeria: A study of apple smartphones. Marketing and Branding Research, 8(2021), 48–64. https://doi.org/10.33844/mbr.2021.60329
Oyenuga, M. O., Akhaine, M. E., & Omale, S. A. (2023a). We need it: How digital marketing tactics influence the purchasing behaviour of Nigerian Millennials. Konfrontasi Journal: Culture, Economy and Social Changes, 10(2), 91–105 https://doi.org/10.33258/konfrontasi2.v10i2.275
Oyenuga, M. O., Marcus, G. O., & Ahungwa, A. I. (2023b). Do Consumers Care About Green Marketing Practices? Insight From A Developing Nation. Budapest International Research and Critics Institute Journal(BIRCIJournal) 6(3), (1424-1436). https://bircu-journal.com/index.php/birci/article/view/7665
Oyenuga, M. O., Andah, R. A., Marcus, G. O., & Agabi, A. U. (2019). Effects of customer relationship management on product innovation in Nigeria. A case study of Xerox HS Nigeria Limited. American Journal of Theoretical and Applied Business, 5(4), 113–126. https://doi.org/10.11648/j.ajtab.20190504.15
Pandian, S. (2020). A study on assertive behaviour and customer-based brand equity. IJAR, 1–2. https://doi.org/10.36106/ijar/6817820
Park, C. & Namkung, Y. (2022). The effects of Instagram marketing activities on customer-based brand equity in the coffee industry. Sustainability, 14(3), 1657. https://doi.org/10.3390/su14031657
Pınar, M. (2020). University branding and measuring brand equity: conceptual framework and empirical studies. The Journal of International Scientific Researches, 5(Ek), 1–5. https://doi.org/10.23834/isrjournal.839937
Pınar, M., Girard, T., & Başfırıncı, Ç. (2020). Examining the relationship between brand equity dimensions and university brand equity. International Journal of Educational Management, 34(7), 1119–1141. https://doi.org/10.1108/ijem-08-2019-0313
Raut, U., Pawar, P., Brito, P., & Sisodia, G. (2019). Mediating model of brand equity and its application. Spanish Journal of Marketing - Esic, 23(2), 295–318. https://doi.org/10.1108/sjme-04-2019-0021
Razzan, A., & Sigit, M. (2023). A study of the relationship between service quality, brand image, and customer satisfaction and its influence on customer loyalty of iPhone users in Yogyakarta. Asian Journal of Economics Business and Accounting, 23(23), 114–127. https://doi.org/10.9734/ajeba/2023/v23i231175
Romaniuk, J., Wight, S., & Faulkner, M. (2017). Brand awareness: revisiting an old metric for a new world. Journal of Product & Brand Management, 26(5), 469–476. https://doi.org/10.1108/jpbm-06-2016-1242
Saleem, S., Rahman, S., & Omar, R. (2015). Conceptualizing and measuring perceived quality, brand awareness, and brand image composition of brand loyalty. International Journal of Marketing Studies, 7(1). https://doi.org/10.5539/ijms.v7n1p66
Sasmita, J. & Suki, N. (2015). Young consumers’ insights on brand equity. International Journal of Retail & Distribution Management, 43(3), 276–292. https://doi.org/10.1108/ijrdm-02-2014-0024
Schivinski, B., & Dąbrowski, D. (2015). The impact of brand communication on brand equity through Facebook. Journal of Research in Interactive Marketing, 9(1), 31–53. https://doi.org/10.1108/jrim-02-2014-0007
Seehanam, N., Akkaranggoon, S., & Ungpannsattawung, S. (2018). An analysis of brand equity components in the context of cultural festivals. Mediterranean Journal of Social Sciences, 9(6), 59–68. https://doi.org/10.2478/mjss-2018-0161
Severi, E., & Ling, K. (2013). The mediating effects of brand association, brand loyalty, brand image and perceived quality on brand equity. Asian Social Science, 9(3). https://doi.org/10.5539/ass.v9n3p125
Shamma, H., & Hassan, S. (2011). Integrating product and corporate brand equity into total brand equity measurement. International Journal of Marketing Studies, 3(1). https://doi.org/10.5539/ijms.v3n1p11
Showrav, D., & Nitu, R. (2018). The influence of brand equity on customer intention to pay premium price of the fashion house brand. Management Science Letters, 1291–1304. https://doi.org/10.5267/j.msl.2018.9.010
Sontaite-Petkeviciene, M. (2020). Customer-based brand equity creation for online grocery stores. Research for Rural Development/Research for Rural Development (Online), 35, 199–206. https://doi.org/10.22616/rrd.26.2020.029
Susanto, B., & Ruswanti, E. (2024). The influence of social media marketing activities on brand loyalty in mobile phone products. Eduvest - Journal of Universal Studies, 4(1), 93–109. https://doi.org/10.59188/eduvest.v4i1.1001
Tania, S., Listiana, E., & Afifah, N. (2023). Social media marketing and word of mouth on product purchase intentions at Bibit fintech startup with the mediation of brand awareness. Journal of Economics Management and Trade, 1–15. https://doi.org/10.9734/jemt/2023/v29i21075
Taylor, S., Hunter, G., & Lindberg, D. (2007). Understanding (customer‐based) brand equity in financial services. Journal of Services Marketing, 21(4), 241–252. https://doi.org/10.1108/08876040710758540
Thảo, N., & Hạnh, D. (2016). Measuring customer-based brand equity: a study of Apple and Samsung in the Vietnamese tablet market. Hue University Journal of Science, Economics and Development, 113(14), 169. https://doi.org/10.26459/jed.v113i14.3662
Waebuesar, A., Aruai, A., Rosli, A., & Azmi, A. (2022). Customer satisfaction and brand loyalty: a survey of Nestlé. International Journal of Tourism and Hospitality in Asia Pacific. https://doi.org/10.32535/ijthap.v5i2.1577
Wang, X., Edison, H., Bajwa, S., Giardino, C., & Abrahamsson, P. (2016). Key challenges in software startups across life cycle stages. 169–182. https://doi.org/10.1007/978-3-319-33515-5_14
Wann, J., Lu, T., Lozada, I., & Cangahuala, G. (2017). University-based incubators’ performance evaluation: a benchmarking approach. Benchmarking: An International Journal, 24(1), 34–49. https://doi.org/10.1108/bij-02-2015-0018
Wondiwoy, W., & Yansen, E. (2023). Understanding customer purchase style, effect on customer satisfaction and purchase intention toward plant-based burgers. Al Qalam Jurnal Ilmiah Keagamaan Dan Kemasyarakatan, 16(6), 2475. https://doi.org/10.35931/aq.v16i6.1741
Yoon, S., & Oh, J. (2016). A cross‐national validation of a new retail customer equity model. International Journal of Consumer Studies, 40(6), 652–664. https://doi.org/10.1111/ijcs.12289
Zhang, G., & Ravishankar, M. (2023). The role of capabilities in digital service development and delivery: the case of start-up organisations. Information Technology and People, 37(3), 1156–1184. https://doi.org/10.1108/itp-05-2021-0404
Page 1 of
Download Count : 20
Visit Count : 78
Keywords
Brand Equity; Brand Awareness; Brand Loyalty; Customer Life-Cycle; Start-Ups
Author(s) Information

How to cite this article
Oyenuga, M. O., & Vu, C. N. (2024). Brand equity and customer life cycle in start-ups. Marketing and Branding Research, 11(1), 51-78. https://doi.org/10.32038/mbr.2024.11.01.05
Acknowledgments
Not applicable.
Funding
Not applicable.
Conflict of Interests
No, there are no conflicting interests.
Open Access
This article is licensed under a Creative Commons Attribution 4.0 International License, which permits use, sharing, adaptation, distribution and reproduction in any medium or format, as long as you give appropriate credit to the original author(s) and the source, provide a link to the Creative Commons license, and indicate if changes were made. You may view a copy of Creative Commons Attribution 4.0 International License here: http://creativecommons.org/licenses/by/4.0/