


Original Research
Analyzing the Drivers of Foreign Direct Investment Inflows and their Impact on Economic Growth in Tanzania
- Abstract
- Full text
- Metrics
This paper aims to deepen understanding and knowledge regarding the analyzing the drivers of foreign direct investment inflows and their impact on economic growth in Tanzania. Many developing countries aspire to shift from agriculture-centric economies to achieve sustainable development through industrialization. Realizing this goal, however, has been challenging, prompting an examination of the sixty-year trends and effects of FDI on Tanzania’s industrialization trajectory. This study employs a comprehensive approach utilizing time series models, specifically the Vector Autoregressive (VAR) model and the Error Correction Model (ECM), to analyze the dynamic influence of FDI on economic growth. By forecasting the 33-year trajectory of economic growth and FDI inflows using data from the World Bank spanning 1990 to 2020, this methodological framework aims to provide a nuanced understanding of the FDI- economic growth relationship, contributing valuable insights to the economic development discourse. The study’s results highlight the significant role of FDI in shaping both short- and long-term FDI progress, which is critical to advancing Tanzania’s economic growth. This underscores FDI as a key driver for economic growth by facilitating economic upgrading through FDI.
Hellena Mohamedy Mushi1* , Mumtaz Ahmed2
1Department of Business Studies, Mzumbe University Mbeya Campus College, Tanzania
2Department of Economics, COMSATS University Islamabad (CUI), Pakistan
ABSTRACT
This paper aims to deepen understanding and knowledge regarding the analyzing the drivers of foreign direct investment inflows and their impact on economic growth in Tanzania. Many developing countries aspire to shift from agriculture-centric economies to achieve sustainable development through industrialization. Realizing this goal, however, has been challenging, prompting an examination of the sixty-year trends and effects of FDI on Tanzania’s industrialization trajectory. This study employs a comprehensive approach utilizing time series models, specifically the Vector Autoregressive (VAR) model and the Error Correction Model (ECM), to analyze the dynamic influence of FDI on economic growth. By forecasting the 33-year trajectory of economic growth and FDI inflows using data from the World Bank spanning 1990 to 2020, this methodological framework aims to provide a nuanced understanding of the FDI- economic growth relationship, contributing valuable insights to the economic development discourse. The study’s results highlight the significant role of FDI in shaping both short- and long-term FDI progress, which is critical to advancing Tanzania’s economic growth. This underscores FDI as a key driver for economic growth by facilitating economic upgrading through FDI.
KEYWORDS: Foreign Direct Investment Inflows, Economic Growth, Tanzania
Foreign Direct Investment (FDI) is widely regarded as a key driver of economic growth, especially in developing countries (Nawaz et al., 2024). It brings with it not only capital but also advanced technologies, management expertise, and access to global markets. FDI has the potential to stimulate productivity, create jobs, and foster competitiveness within a nation’s economy (Ai-Jun et al., 2024). By injecting new resources into vital sectors, FDI encourages economic diversification. For Tanzania, like many other developing nations, FDI could be the linchpin for unlocking long-term sustainable growth, transforming underdeveloped sectors into engines of prosperity (Utouh et al., 2024). However, realizing this potential requires a strategic approach to attract and retain high-quality investments that can have a lasting impact on the economy.
Despite the acknowledged global benefits of FDI, Tanzania’s experience in harnessing this investment for economic growth has been fraught with challenges (Mwakabungu & Kauangal, 2023). These hurdles range from policy inconsistencies, infrastructural inadequacies, and regulatory barriers to limited institutional capacities that deter foreign investors. Additionally, external factors like global economic fluctuations and internal issues such as governance concerns and inefficient public services further complicate the country’s ability to fully capitalize on FDI (Utouh et al., 2024). The Tanzanian government has made strides to improve the investment climate, but there remains a critical need for more robust frameworks that ensure investor confidence and sustainable development outcomes.
In Tanzania, FDI holds the promise of fundamentally altering the country’s economic trajectory. As an economy that relies heavily on sectors like agriculture, mining, and tourism, Tanzania stands to benefit significantly from FDI-driven innovation and infrastructure development (Kitole & Utouh, 2023). Investment in key industries, such as manufacturing, energy, and telecommunications, could transform these sectors, making them more competitive and integrated into the global value chain (Larbi & Nawal, 2023). FDI can also play a pivotal role in helping the country transition to a knowledge-based economy, fostering entrepreneurship and innovation. By attracting the right mix of investments, Tanzania can position itself as an economic leader in the East African region, boosting both domestic growth and regional integration.
Several countries serve as prime examples of how FDI can be leveraged to spur economic growth (Alhassan et al., 2024). China, for instance, has used FDI to transition from an agrarian economy to the world’s manufacturing powerhouse, benefiting from technology transfers, job creation, and infrastructure development (Zhao et al., 2024). Indonesia has also seen remarkable success, attracting FDI to drive its industrialization, particularly in electronics and textiles, which has propelled it into one of the fastest-growing economies in Asia (Fazaalloh, 2024). Similarly, India's open-door policy towards FDI transformed it from a resource-poor island nation into a global financial and trade hub (Sharmiladevi, 2024). These success stories highlight the potential for FDI to accelerate economic growth when combined with sound policies, favorable business environments, and strategic sectoral focus in Thailand (Preepremmote, 2024) and Nepal (Dahal et al., 2024). These examples offer valuable lessons for Tanzania, demonstrating how the effective utilization of foreign investments can lead to rapid economic transformation.
Although FDI presents substantial opportunities for Tanzania, there remains a significant gap in understanding its precise impact on the country's economic growth (Magai, 2022). Existing studies often focus on broad macroeconomic variables without delving deeply into the specific channels through which FDI influences economic outcomes in Tanzania. This gap is particularly important given the country's unique socio-economic conditions, institutional frameworks, and policy environment. Understanding the nuances of how FDI interacts with factors such as trade, government expenditure, population growth, and debt services is crucial for policymakers to make informed decisions. Bridging this knowledge gap could enable Tanzania to better harness the power of FDI for inclusive and sustainable growth.
The remainder of this paper is organized to provide a comprehensive exploration of the role of FDI in Tanzania’s economic growth. Section 2 delves into the theoretical frameworks that underlie the study, presenting key economic theories and models that inform the analysis of FDI’s impact. In Section 3, we conduct a thorough review of the existing empirical literature, examining prior studies that have investigated the relationship between macroeconomic factors and FDI inflows. Section 4 outlines the methodology used in this study, including the data sources, variable selection, and econometric techniques employed to assess the relationship between FDI and economic growth. The results of the empirical analysis are presented in Section 5, followed by a discussion in Section 6, where the findings are critically interpreted in the context of existing literature. Finally, Section 7 concludes the paper by summarizing the key insights and providing policy recommendations to inform future research and guide Tanzanian policymakers in leveraging FDI more effectively.
Theoretical Foundation
This study utilizes the Neoclassical economic growth theories, which elucidate the relationship between Foreign Direct Investment (FDI) and economic growth in host countries. They contend that economic growth occurs through the establishment of efficient markets, the encouragement of free trade, the reduction or removal of restrictions on foreign investment, and the elimination of governmental regulations that hinder market operations (Mwakabungu & Kauangal, 2023).
Empirical Literature
Over the past few decades, FDI has been widely recognized as a significant contributor to economic growth in developing nations, including Tanzania. FDI plays a crucial role in addressing capital shortages, fostering technological advancement, and creating employment opportunities, all of which are essential for sustainable growth. Empirical studies have provided ample evidence to support the assertion that FDI serves as a key engine of economic progress in Tanzania.
Several studies have documented the sectoral benefits of FDI in Tanzania (Mkonyi et al., 2022) demonstrated that FDI in the manufacturing and mining sectors has been instrumental in increasing output, improving productivity, and enhancing the competitiveness of these industries. The influx of foreign capital has modernized industrial operations, introduced advanced technologies, and fostered skills development among local workers. The mining sector, in particular, has attracted substantial FDI due to Tanzania's vast natural resources, with foreign investments significantly improving extraction methods and resource management. To foster growth and maximize trickle-down effects, there should be a conscious effort to enhance policies and implement necessary measures that attract, prioritize, and direct FDI into sectors with higher growth potential, such as agriculture and tourism (Masanja, 2018). The effects of FDI in sectors like manufacturing and infrastructure may indirectly benefit agriculture through improved processes, logistics, and technological advancements. FDI's positive effects on trade, exports, and GDP growth, as highlighted in South Africa and Cameroon, could have indirect benefits for the agricultural sector through enhanced trade openness and infrastructure development (Sharmiladevi, 2024) reveals that agricultural value added has a significant relationship with economic growth and trade openness in both the short and long run. However, inward FDI and stock of FDI do not have a significant impact on the agricultural sector, suggesting that the growth in agriculture is driven more by trade policies than by FDI. FDI’s general positive effects on sectors like manufacturing and real estate could indirectly benefit agriculture through improved infrastructure and technological advancements. Epaphra and Mwakalasya (2017) suggested that FDI inflows have no significant effect on the agriculture value-added-to-GDP ratio in Tanzania despite the notable increase in FDI inflows over the past two decades. Unsurprisingly, the results indicate a positive correlation between the FDI inflows-to-GDP ratio and real GDP growth rate. Nonetheless, the lack of impact on the agricultural sector highlights the need for targeted efforts to channel FDI into areas with higher growth potential within the sector (Epaphra, 2016). Evidence from the mining sector remains inconclusive, despite its significant share of FDI inflows. The unexpected negative causal relationship between FDI inflows and the agricultural sector in Tanzania may be attributed to the relatively low level of FDI directed toward agriculture compared to other sectors. However, it is plausible that FDI is contributing to GDP growth through sectors such as manufacturing, construction, transport, storage, and communication, without necessarily improving the overall welfare of the population.
Epor et al. (2024) show that FDI has a positive but insignificant effect on economic growth in the countries studied, implying that sectors like mining, manufacturing, water, gas, and electricity receive benefits from FDI, though the long-term effects are not always substantial. Fazaalloh (2024) highlights that FDI in mining, manufacturing, water, gas, and electricity sectors significantly contributes to economic growth, suggesting these sectors benefit substantially from foreign investments. Thaddeus et al. (2024) observed that macroeconomic factors such as gross capital formation, trade openness, and government expenditure have a significant positive impact on economic growth in Cameroon. FDI, however, had a negative effect, indicating that the role of FDI in specific sectors, including manufacturing, water, gas, and electricity, may vary in different regions. Telatar and Adimli (2024) found that FDI negatively affects renewable energy consumption (REC) in Türkiye. This finding aligns with the Pollution Haven Hypothesis (PHVH), which suggests that firms relocate to countries with less stringent environmental regulations, which could apply to sectors like manufacturing, mining, and energy.
Service-oriented sectors like technology and remittances, FDI could potentially drive development in these areas through investment in infrastructure and human capital. Fazaalloh (2024) further notes that FDI in hotels, restaurants, and real estate sectors also has a positive impact on economic growth, underscoring their role in fostering development through enhanced service delivery and infrastructure. Positive effects of FDI on economic growth in sectors like exports and trade could indirectly impact service sectors such as hotels and real estate. The broader effects of FDI on economic growth, trade, and financial inclusion can indirectly benefit service sectors such as hospitality and real estate through improved financial access and investment climate.
Nawaz et al. (2024) noted that natural resources have a unidirectional impact on both CO2 emissions and GDP, signifying the importance of regulating resource extraction to balance environmental and economic objectives. This requires a policy shift towards sustainable management of natural resources to mitigate environmental degradation. Van Tran et al., (2024) demonstrated that FDI has an asymmetric long-run impact on the ecological footprint, suggesting that the effects of FDI on the environment may vary depending on the region's economic structure and resource management practices. Telatar and Adimli (2024) confirmed the PHVH in Türkiye, showing that FDI negatively affects REC. This suggests that FDI-driven businesses might be relocating to avoid stricter environmental regulations in their home countries, impacting local environmental sustainability.
The role of FDI in driving infrastructure development in Tanzania has also been well documented. Gibogwe et al. (2022) suggested that in Tanzania, FDI contributes to an increase in income, while economic growth simultaneously attracts and stimulates further FDI inflows. Additionally, there is a strong positive relationship between these variables, indicating that foreign direct investment significantly influences the country's financial inflows. A well-developed and productive local capacity stands to benefit from FDI; however, this can only be realized by offering incentives to foreign firms to encourage positive spillover effects to other sectors. Shadab and Alam (2024) found that in the UAE, high-tech exports significantly enhance economic growth, while FDI positively influences infrastructure development by promoting technological innovation. This suggests that FDI plays a crucial role in building high-tech infrastructure. Sarker (2024) revealed that total trade (exports and imports) has a weakly significant positive effect on economic growth in the long run, and FDI positively impacts economic growth in both the short and long run. This suggests that improvements in infrastructure, supported by FDI and trade, can promote long-term economic growth. He (2024) highlights that there is a regional disparity in China, with eastern regions being more responsive to FDI and e-commerce influences on export trade compared to the western regions. This suggests that FDI in infrastructure development is more concentrated in the eastern areas, promoting better trade and export capacities. Zhao et al., (2024) show that in the eastern region, FDI positively affects output and technological innovation in the high-tech industry. In contrast, in the central and western regions, FDI boosts output but suppresses technological innovation. Meanwhile, in the northeastern region, FDI enhances technological innovation but reduces output, indicating that the impact of FDI on infrastructure and technology transfer varies by region. Zhao et al. (2024) show that in the eastern region, FDI positively affects output and technological innovation in the high-tech industry.
In contrast, in the central and western regions, FDI boosts output but suppresses technological innovation. Meanwhile, in the northeastern region, FDI enhances technological innovation but reduces output, indicating that the impact of FDI on infrastructure and technology transfer varies by region. Shadab and Alam (2024) revealed that FDI and high-tech exports have a bidirectional relationship in the UAE, promoting economic growth and facilitating the transfer of technology. However, renewable energy consumption had a negative impact on growth, potentially due to the current state of technology in that sector. Van Tran et al. (2024) found that FDI has an asymmetric impact on the ecological footprint in the long run, suggesting that FDI may influence the transfer of environmentally friendly technology or expertise to reduce ecological damage. This highlights the need to balance FDI with sustainable practices. FDI's influence on export trade in China (He, 2024) and its potential role in developing financial inclusion systems in MENA countries. Al-Smadi and Al-Smadi (2024) could support technology transfer and skill development.
Beyond its direct impact, FDI also stimulates domestic investment by enhancing the business environment. Mwakabungu and Kauangal (2023) demonstrate the existence of a long-term relationship between financial development and trade in Tanzania. Additionally, their findings reveal a positive and statistically significant unidirectional causality from FDI inflows to economic growth in both the short and long run in Tanzania. Eloho et al. (2024) demonstrated that in Nigeria, while VAT and customs duties have direct effects on FDI, company income tax and stock market capitalization show no significant relationship with FDI. This suggests that optimizing the tax environment is essential to enhance domestic and foreign investment. Husnain et al. (2024) reveal that institutional quality, FDI, and local investment significantly foster economic growth in Latin America. They recommend improving the business environment by prioritizing institutional reforms, attracting more FDI, and encouraging local investments. Mano (2024) indicated that FDI can "crowd out" private domestic investment (PDI) in the West African Economic and Monetary Union (WAEMU). This implies that while FDI can drive economic growth, it may compete with domestic investment unless policies are in place to integrate both. Al-Smadi and Al-Smadi (2024) emphasize the importance of financial inclusion in attracting FDI inflows in MENA countries. Access to financial services, availability, and usage all play key roles in enhancing the business environment, making it easier for foreign capital to enter and stimulate economic growth (Kitole & Utouh, 2023). FDI Granger-causes industrialization, indicating that as the industrial sector flourishes, it, in turn, stimulates further FDI inflows. In the long run, FDI significantly influences the growth of industrialization in Tanzania, while the exchange rate has a notable impact on industrialization growth in the short run. The study recommends that the Bank of Tanzania implement measures to address underperforming economic indicators, such as managing the exchange rate, controlling inflation, and enhancing the money market to improve capital availability and accessibility.
Makhoba (2024) found that in South Africa, FDI positively influences export growth, indicating that FDI-driven investments help boost export levels. This relationship further stimulates GDP growth, showing how FDI can foster trade-driven economic growth. Sarker (2024) noted that exports positively affect economic growth, while imports have insignificant effects. The study highlights the importance of focusing on export-led growth strategies, which are further strengthened by FDI in both the short and long runs. Additionally, crises distort FDI-led growth, emphasizing the need for resilience in policy design to safeguard against economic shocks. He (2024) highlights that China's eastern regions are more responsive to FDI and e-commerce, driving export growth more significantly than in the western regions. This regional disparity indicates that FDI has a crucial role in enhancing export capacity, but its impact may vary based on location and infrastructure. Sharmiladevi (2024) notes that trade openness has a significant relationship with agricultural value added and economic growth, further reinforcing the role of trade policies in sectors like agriculture. Bieleń et al. (2024) show that in Central and Eastern European countries, economic growth correlates positively with global economic development through FDI and trade flows. However, this effect is statistically insignificant for West African nations, highlighting differences in how FDI and global linkages affect regional economic growth.
Magai (2022) concludes that there is a positive relationship between the explanatory variables and economic growth. Consequently, the Tanzanian government should promote exports to harness the potential benefits of trade and FDI on economic growth. Utouh et al. (2024) concluded that Foreign direct investment (FDI) had a relatively minimal direct impact on gross domestic product, indicating that other factors were more influential in shaping economic performance. Additionally, there was no bidirectional causal relationship between GDP and FDI; they operated independently of each other. It has been demonstrated that endogenous shocks significantly drive changes in both GDP and FDI, highlighting the importance of internal forces within the economic system. Boay et al., (2023) The study recommends that the government should allocate resources effectively to economic activities aimed at stimulating macroeconomic variables. This approach will help attract more FDI and promote sustainable economic growth in both the short and long run. Taylor (2020) The findings confirm that the type of FDI may be more relevant than the quantity in explaining economic growth. While other control variables show their expected signs, the openness to trade does not align with expectations. Based on these insights, the study recommends implementing more strategic FDI incentives specifically targeted toward the primary sector (Mwanga, 2022). The findings indicate a long-run relationship between FDI and human development index (HDI) in Tanzania. Specifically, FDI is positively associated with education and standard of living, while it has a negative relationship with health in the long run. In the short run, the study finds a positive correlation between FDI and health, education, and standard of living; however, the results for health and standard of living were insignificant. The study concludes that the impact of FDI on human development is sensitive to the specific indices used. The main substantive result is that inward FDI positively affects human development in Tanzania. Therefore, to achieve optimal outcomes, policymakers need to be aware of and consider the advantages and disadvantages of FDI in various aspects of human development.
The impact of FDI on economic growth is also closely tied to the policy environment of the host country. Byaro et al. (2022) concluded that population life expectancy and exports of goods and services all show positive and significant impacts on economic growth in the long run. The magnitude of population life expectancy on economic growth is greater than that of FDI inflows or exports, meaning that economic growth benefits more from population health. Recommend that the government implement policies aimed at enhancing population health by expanding access to essential public health interventions, such as increasing the number of healthcare facilities, improving nutrition, and providing comprehensive medical care under universal health coverage. These efforts are crucial for boosting longevity and, consequently, the economy. In summary, we conclude that prioritizing investments in health is vital, as a healthier population is strongly linked to higher levels of economic growth and income. Tsaurai (2024) recommended to implementation of optimal property rights strategies to enhance FDI inflows into African nations.
Mba and Chijioke (2024) and Mawutor et al. (2023) highlighted that remittances and FDI positively impact economic development, but exchange rates negatively influence growth. These findings emphasize the need for policymakers to balance exchange rate stability and attract FDI to improve the economic environment. Al-Mutairi et al. (2024) recommended focusing on education, reducing unemployment, and controlling inflation as part of a broader policy framework to foster long-term economic growth. Managing these factors effectively can create a conducive policy environment for sustainable development. Malik and Sah (2024) suggest that policymakers in emerging economies should implement mechanisms to monitor the short-term impacts of FDI and adjust policies accordingly to maximize economic gains, thereby creating a more adaptive policy environment. Thaddeus et al. (2024) showed that macroeconomic indicators such as trade openness, government expenditure, and exchange rate management positively influence economic growth in Cameroon. Conversely, factors such as inflation, FDI, and foreign aid negatively affected growth in both the short and long runs, indicating that effective policy measures are needed to optimize the positive effects of FDI and manage inflation. Omran and Bilan (2024) show that FDI is crucial in reducing inflation and boosting GDP and exports, although it may also increase unemployment. These findings suggest that policies need to balance the positive effects of FDI on economic stability with its potential drawbacks, such as higher unemployment.
Empirical literature consistently supports the notion that FDI has been a major driver of economic growth in Tanzania (Magai, 2022; Mwakabungu & Kauangal, 2023; Taylor, 2020). Its positive impacts are observed through technology transfer, capital accumulation, infrastructure development, and the stimulation of domestic investment. However, realizing the full potential of FDI requires continued policy reforms, addressing regional disparities, and mitigating risks associated with excessive foreign capital dependency. The insights from this body of literature provide a valuable foundation for understanding the intricate relationship between FDI and Tanzania’s economic growth trajectory.
Research has yielded mixed results regarding the impact of FDI on economic growth, largely due to geographical variations and differing economic conditions across nations (Gibogwe et al., 2022; Kitole & Utouh, 2023; Utouh et al., 2024). To gain a more precise understanding of the FDI-growth relationship, it is essential to examine this connection at the country level. Addressing this gap, the current study investigates the relationship between FDI and economic growth in Tanzania, with a focus on the factors influencing FDI, including inflows, trade, government expenditure, population growth rate, total debt service, domestic credit to the private sector, and GDP per capita. This study aims to support policy formulation by providing evidence-based insights that can inform strategies for fostering Tanzania's economic growth. Additionally, it enriches the empirical literature by offering a detailed examination of the factors driving FDI in Tanzania, which can serve as a valuable reference for other developing nations with similar goals.
Method
Data Authenticity and Variable Selection
In this article, yearly data from the World Bank Group was used from 1990 to 2022. The choice to utilize World Bank statistics spanning from 1990 to 2022 is due to Tanzania's recent surge in Foreign Direct Investment (FDI) inflows, coupled with consistent GDP growth. This economic progress enabled Tanzania to achieve lower middle-income country status in July 2020 (World Bank, 2022). The advantage of using this data source lies in the fact that World Bank data is widely regarded as reliable and credible. The organization follows strict data collection and verification procedures, ensuring high-quality and consistent information. This level of reliability strengthens the credibility of the study’s outcomes. Additionally, the World Bank provides a comprehensive archive of historical data, which is essential for trend analysis and forecasting. Longitudinal data enables researchers to track patterns, observe changes, and produce more precise predictions. Nevertheless, a key weakness of this data source is its limitations, as some countries may have incomplete or missing data, especially in low-income or politically unstable regions. Researchers must be mindful of these data gaps and ensure their conclusions are not skewed or biased by the absence of certain data points. Economic growth is indicated by a ratio of GDP and foreign direct investment initially used by Hasan and Barua (2015), Boay et al. (2023), and Epaphra (2016) that are Trade (T), government expenditure (GOV-E) population growth rate (POP.GRO), Total Debt Services (TDS), Domestic Credit to Private Sector (DCPS) and GDP per capita (GDP.CAP), Inflation, consumer prices (INFL), Gross fixed capital formation (GFCF). Detailed definitions, measuring units and data source is presented in Table 1. Thus, the empirical model is presented as:
…………………………………… (1)
Whereas α is the intercept, β1 to β6 are the coefficients for the respective variables, whereas εt is the random error term.
Variables and Their Measuring Units and Sources
|
Variable Names |
Abbreviations |
Measuring unit |
|
|
1 |
“Foreign direct investment, net inflows” |
FDI |
“As % of GDP” |
|
2 |
“Trade “ |
TRD |
“As % of GDP” |
|
3 |
“General government final consumption expenditure” |
GOV-E |
“As % of GDP” |
|
4 |
“Population growth “ |
As annual % |
|
|
5 |
“Domestic credit to private sector” |
“As % of GDP” |
|
|
6 |
“Total Debit Services” |
TDS |
“As % of GDP” |
|
7 |
GDP per capita growth |
As annual % |
|
|
Inflation, consumer prices |
INFL |
As annual % |
|
|
9 |
GFCF |
As % of GDP |
Source: World Bank (2022)
Selection of Economic Variables
The selection of these economic variables, Foreign Direct Investment (FDI), trade, government expenditure, population growth rate, total debt services, domestic credit to the private sector, GDP per capita, inflation, consumer prices, and gross fixed capital formation was based on their significance as key drivers of FDI and economic growth in Tanzania. These variables are commonly used in economic studies as they directly influence a country's investment climate, economic performance, and ability to attract foreign capital. For example, FDI and trade foster economic activity, government expenditure impacts infrastructure and development, while population growth and domestic credit can reflect the market's potential and financial health. Similarly, variables like inflation, consumer prices, and gross fixed capital formation influence the cost of doing business and long-term investment decisions, making them essential for understanding the broader economic landscape and its connection to FDI inflows. FDI is central to the study as it directly reflects the level of foreign capital being invested in Tanzania (Utouh et al., 2024). It serves as a key measure of economic openness and international investment attractiveness, which are crucial for economic growth. Trade involves the exchange of goods and services across borders. It is a vital component of economic growth because increased trade can lead to higher investment and greater market integration, influencing both domestic and foreign investor decisions in Tanzania (Magai, 2022).
Government spending on infrastructure, health, education, and other public services can stimulate economic growth in Tanzania (Magai, 2018; Taylor, 2020). It directly affects the business environment, infrastructure development, and overall investment climate, making it a critical factor in determining FDI flows. Population growth impacts the size of the labor force and consumer market. A growing population can signal future economic expansion and market demand, making the country attractive for foreign investors looking for new opportunities (Mwanga, 2022). Debt servicing obligations can influence economic stability and investor confidence. High levels of debt may strain government resources, reducing public investment and potentially deterring FDI (Lelya & Ngaruko, 2021). Monitoring debt levels helps gauge the risk environment for investors. Access to domestic credit is crucial for private sector growth. When local businesses have better access to financing, it fosters entrepreneurship and economic activity, creating a favorable environment for FDI as foreign investors look for dynamic local markets (Odass, 2023). GDP per capita serves as a measure of the average income and living standards in the country. Higher GDP per capita indicates a wealthier population and a stronger economy, which attracts investors seeking stable and profitable markets (Utouh et al., 2024). Inflation affects the purchasing power of consumers and the cost of doing business. High or volatile inflation rates can deter investment by increasing uncertainty and reducing profitability. Low, stable inflation is attractive for long-term investments. GFCF measures the investment in physical assets like buildings, machinery, and infrastructure. This is a key indicator of the level of economic development and capital investment within the country, which in turn affects FDI by showcasing a conducive environment for business expansion and growth. Each of these variables plays a significant role in shaping Tanzania's economic landscape, and collectively, they provide a comprehensive view of the factors influencing FDI and overall economic growth.
Study Model
The study employed a comprehensive methodological framework based on a time-series research design from 1990 to 2022. This design was chosen strategically to analyze lagged effects, providing valuable insights into how economic variables influence FDI growth over time. This temporal approach is essential for understanding the evolving relationships among FDI, trade, government expenditure, population growth rate, total debt services, domestic credit to the private sector, GDP per capita, inflation, consumer prices, and gross fixed capital formation. The use of Vector Autoregressive (VAR) and Vector Error Correction Model (VECM) is well-suited to the research objectives and data. VAR models effectively capture the interdependencies and dynamic interactions among multiple time-series variables, allowing for the exploration of short-term dynamics through the incorporation of lagged values.
Moreover, the VECM is crucial for analyzing long-term equilibrium relationships and adjusting short-term deviations from this balance. The justification for using these models stems from their ability to thoroughly capture both short-term variations and long-term patterns, highlighting the intricate connections among economic factors. Including variables such as FDI, trade, government spending, population growth rate, total debt services, domestic credit to the private sector, GDP per capita, inflation, consumer prices, and gross fixed capital formation in the model reflects a comprehensive approach to understanding the various influences on FDI in Tanzania. This methodology not only strengthens the reliability of the results but also broadens the applicability of the study's conclusions. The combination of time-series analysis and VAR-VECM models creates a solid framework for a detailed examination of the complex relationships between economic variables and their impact on Tanzania's FDI growth from 1990 to 2022.
Model Estimation
In this study, equation 1 represents the economic growth function, which is used to explain the rate of FDI in Tanzania. The equation includes several independent variables: Foreign Direct Investments, TRD= Trade, GOVE= Government Expenditure, POP.GRO=, Population Growth Rate, INFL= Inflation, TDS= Total Debt Services, DCPS= Domestic Credit to Private Sector, GDP.CAP = GDP per capita, EXCHR= Exchange Rate, GFCF= Gross Fixed Capital Formation. The equation also includes a stochastic term represented by et which captures the random or unobserved factors that affect industrial performance.
……………. (1)
To convert Equation 1 into a linear format, the Cobb-Douglas log-linear model is utilized. Equation 2 presents the log-linear representation of Equation 1, with each independent variable elevated to its respective coefficient.
GDP-CAPt=α0(DCPSt)α1(EXCHRt)α2(FDIt)α3(GFCFt)α4(GOV-Et) α5(INFLt)α6(POP-GROt) α7(TDSt)α8µtεt… …... (2)
To simplify the equation further, it is converted into natural logarithm form in Equation 3. In this equation, the dependent variable GDP.CAP represents the natural logarithm of economic growth, while the independent variables are expressed as their respective natural logarithms (FDI, TRD, GOVE, POP.GRO, Growth Rate, INFL, TDS, DCPS, EXCHR, GFCF).
ln (GDP-CAPt) =α0+α1ln(DCPSt)+α2ln(EXCHRt)+α3ln(FDIt)+α4ln(GFCFt)+α5ln(GOV_Et)+α6ln(INFLt)+α7ln(POP_GROt)+α8ln(TDSt)+ ԑt………..(3)
The coefficients α in Equation 3 represent the long-run elasticities of the dependent variable, illustrating the impact of changes in the independent variables on economic growth over the long term.
Cointegration Test
The cointegration test is a fundamental step in assessing the long-term relationship between variables, especially in time series analysis. In this study, the cointegration test was done using the Bounds test. Bounds test is conducted if some variables are stationary at level or and others at 1st difference. That is a combination of 1(1) and 1(0. For an equation with variables that are stationary at level, the Vector Autoregressive (VAR) model can be written as:
………… (4)
Where:
is a dimensional vector of the variables.
is the intercept term (constant).
are coefficient matrices that capture the lagged relationships between variables.
is the lag length of the model.
is the vector of white noise error terms.
Thus consider a vector Autoregressive (VAR) model of vector with variables, where the variables are integrated at order one . The model for the explained variable can be written as:
Where:
is a dimensional vector of the variables.
is the matrix that contains the long-term information about the system (i.e. the cointegrating relationships).
are the matrices that capture short-run dynamics.
represents the first differences of variables, accounting for short-term changes.
is the vector of error terms or residuals at time .
Vector Error Correction Model (VECM)
The Vector Error Correction Model (VECM) was employed to capture both the long-run and short-run dynamics. The VECM is an extension of the VAR model and is suitable for handling non-stationary variables while exploring the short-term adjustments to long-term equilibrium. Therefore, the cointegration equation can be specified in the VECM as:
…………(6)
Where:
- is the first difference of the logarithm of GDP per capita at time , capturing short-run dynamics.
- represent the first difference of the independent variables DCPS, EXCHR, FDI, GFCF, GOV_E, INFL, POP_GRO, TDS lagged by periods
- represents the short run coefficients for each variable over n Lags
Short-run Impact of FDI
To investigate the short-run effects of foreign direct investment on industrial sector growth, thus equation 7 was later transformed into equation 8:
……… (7)
Where:
- is the first difference of the logarithm of GDP per capita at time , capturing short-run dynamics.
- represent the first difference of the independent variables DCPS, EXCHR, FDI, GFCF, GOV_E, INFL, POP_GRO, TDS lagged by periods
- represents the short run coefficients for each variable over n Lags
Results
Results presented in Table 1 provide the mean. This reflects the average value of each variable across 33 observations. For instance, the average domestic credit to the private sector (DCPS) is 9.86%, and the average exchange rate (EXCHR) is 1219.79. Standard Deviation, this shows the extent of variation or dispersion in the data. Variables like the exchange rate (659.14) and inflation (9.45) display high variability, indicating substantial fluctuations over time. Skewness most variables show some degree of skewness, with positive skewness for variables such as inflation (1.27) and government expenditure (1.30), meaning that the distribution is right-tailed. On the other hand, GDP per capita (-0.93) is negatively skewed, indicating a left-tailed distribution. Kurtosis measures the "tailedness" of the distribution. Most variables exhibit kurtosis values close to 3, indicating a near-normal distribution, except for the population growth rate (4.12), which suggests a leptokurtic distribution (more extreme values). Jarque-Bera Test checks whether the variables follow a normal distribution. A low probability value (p < .05) indicates deviation from normality. For example, government expenditure (p = 0.00695) and total debt services (p = .04) reject the null hypothesis of normality, while other variables such as DCPS and exchange rate show no significant deviation from normality.
Table 1
Descriptive Statistics
|
|
DCPS |
EXCHR |
FDI |
GDP_CAP |
GFCF |
GOV_E |
INFL |
NX |
POP__GRO |
TRD |
TDS |
|
Mean |
9.85 |
1219.79 |
2.53 |
2.22 |
29.06 |
11.06 |
11.58 |
8.04 |
2.85 |
41.51 |
1.81 |
|
Median |
11.46 |
1196.31 |
2.31 |
2.67 |
30.77 |
10.04 |
7.02 |
9.67 |
2.80 |
41.90 |
1.26 |
|
Maximum |
14.61 |
2297.76 |
5.66 |
4.64 |
42.68 |
19.63 |
35.82 |
13.60 |
3.89 |
65.69 |
5.31 |
|
Minimum |
2.94 |
195.05 |
0.00 |
-2.30 |
14.72 |
7.69 |
3.29 |
-1.07 |
1.88 |
23.98 |
0.26 |
|
Std. Dev. |
3.9 |
659.14 |
1.48 |
1.96 |
7.91 |
3.58 |
9.45 |
4.36 |
0.38 |
11.97 |
1.56 |
|
Skewness |
-0.62 |
0.27 |
0.22 |
-0.93 |
0.01 |
1.30 |
1.27 |
-0.52 |
0.06 |
0.40 |
1.07 |
|
Kurtosis |
1.90 |
1.99 |
2.41 |
2.97 |
2.01 |
3.60 |
3.39 |
1.89 |
4.12 |
2.26 |
2.73 |
|
Jarque-Bera |
3.77 |
1.81 |
0.75 |
4.79 |
1.34 |
9.93 |
9.10 |
3.21 |
1.77 |
1.65 |
6.40 |
|
Probability |
0.15 |
0.40 |
0.68 |
0.09 |
0.50 |
0.00 |
0.01 |
0.20 |
0.41 |
0.43 |
0.04 |
|
Sum |
325.35 |
40253.34 |
83.55 |
73.42 |
959.27 |
365.22 |
382.34 |
265.56 |
94.24 |
1369.90 |
59.79 |
|
Sum Sq. Dev. |
503.16 |
3032.74 |
70.12 |
123.17 |
2003.65 |
410.36 |
2862.10 |
610.59 |
4.75 |
4587.05 |
78.33 |
|
Observations |
33 |
33 |
33 |
33 |
33 |
33 |
33 |
33 |
33 |
33 |
33 |
Note. FDI= Foreign Direct Investments, TRD= Trade, GOVE= Government Expenditure, POP.GRO=, Population Growth Rate, INFL= Inflation, TDS= Total Debt Services, DCPS= Domestic Credit to Private Sector, GDP.CAP = GDP per capita, EXCHR= Exchange Rate, GFCF= Gross Fixed Capital Formation.
Unit root Test
In this study, a unit root test was conducted to assess the presence of unit roots in the time series data. The presence of unit roots can indicate non-stationarity, which can lead to spurious regression results. To test for unit roots, the Augmented Dickey-Fuller (ADF) test was employed. Table 2 presents the detailed results of the unit root test for each variable, including the test statistics and their corresponding critical values at different significance levels (1%, 5%, and 10%). The results in Table 2 reveal that variables FDI= Foreign Direct Investments, GOVE= Government Expenditure, POP.GRO=, Population Growth Rate, EXCHR= Exchange Rate, DCPS= Domestic Credit to Private Sector, INFL= Inflation, were found to be stationary at their level, as the test statistics for these variables were less than their respective critical values. This suggests that these variables do not exhibit non-stationarity and can be used in further analysis without transformation. However, TRD= Trade, GDP.CAP = GDP per capita, TDS= Total Debt Services, GFCF= Gross Fixed Capital Formation, TDS= Total Debt Services and TRD= Trade exhibited non-stationarity at their levels, as the ADF test statistics exceeded the critical values. This indicates that these variables require transformation to achieve stationarity. To address the issue of non-stationarity, first-order differencing was applied to the non-stationary variables. The differenced variables (TRD, GDP. CAP, TDS, GFCF, TDS, TRD) were then tested for stationarity using the ADF test. The results showed that the differenced variables became stationary, as the ADF test statistics were now below the critical values (see Table 2). This transformation ensures that the variables are suitable for further analysis, mitigating the risk of spurious regression results.
Dickey Fuller Tests for Stationarity
|
Variables |
drift lags |
p-value for Z(t) |
Test statistic |
1% Critical value |
5% Critical value |
10% Critical value |
|
GDP.CAP |
(1,1) |
0.000 |
-7.02 |
-3.66 |
-2.96 |
-2.61 |
|
DCPS |
(0,0) |
0.000 |
-4.41 |
-3.66 |
-2.96 |
-2.61 |
|
EXCHR |
(0,0) |
0.000 |
-6.26 |
-4.35 |
-3.59 |
-3.23 |
|
FDI |
(0,0) |
0.004 |
-3.09 |
-3.65 |
-2.95 |
-2.61 |
|
GFCF |
(1,1) |
0.000 |
-5.07 |
-3.66 |
-2.96 |
-2.61 |
|
GOV_E |
(0,0) |
0.000 |
-5.50 |
-3.67 |
-2.96 |
-2.62 |
|
INFL |
(0,0) |
0.004 |
-2.87 |
-2.63 |
-1.95 |
-1.61 |
|
NX |
(1,1) |
0.000 |
-5.22 |
-3.66 |
-2.96 |
-2.61 |
|
POP__GRO |
(0,0) |
0.000 |
-5.06 |
-4.28 |
-3.56 |
-3.21 |
|
TDS |
(1,1) |
0.000 |
-4.83 |
-3.66 |
-2.96 |
-2.61 |
|
TRD |
(1,1) |
0.000 |
-3.64 |
-2.64 |
-1.95 |
-1.61 |
Note. FDI= Foreign Direct Investments, TRD= Trade, GOVE= Government Expenditure, POP.GRO=, Population Growth Rate, INFL= Inflation, TDS= Total Debt Services, DCPS= Domestic Credit to Private Sector, GDP.CAP = GDP per capita, EXCHR= Exchange Rate, GFCF= Gross Fixed Capital Formation
Table 2 presents the results of the Dickey-Fuller tests conducted to check the stationarity of the variables used in the study. These variables include Foreign Direct Investment (FDI), trade (TRD), government expenditure (GOV_E), population growth rate (POP_GRO), inflation (INFL), total debt services (TDS), domestic credit to the private sector (DCPS), GDP per capita (GDP_CAP), exchange rate (EXCHR), and gross fixed capital formation (GFCF). The test statistics, corresponding p-values, and critical values at 1%, 5%, and 10% significance levels are reported. A variable is considered stationary when the p-value is less than the significance threshold (e.g., .05), indicating that the null hypothesis of a unit root is rejected. The results indicate that most variables are stationary at the 1% significance level, as evidenced by p-values below .01, except for FDI and INFL, which are stationary at the 5% significance level.
The general form of the ADF is estimated by the following regression.
The standard Dickey-Fuller model has been augmented by ΔKt-i, where Yt represent a time series (a linear time trend), Δ is the first difference operator, α is a constant, and εt is the random error term while β, δ, and μ are parameters to be estimated. Equation 8 tests the unit root of the random walk with the intercept, while Equation 9 tests for a random walk with the intercept and time trend.
Figure 1 highlights the critical role of including a drift term in the assessment of stationarity for the variables examined. The presence of a drift term is essential, as it enables the variables to attain stationarity, suggesting that without this adjustment, the underlying trends and fluctuations in FDI and economic growth may lead to misleading conclusions regarding their long-term behavior and relationships. This reinforces the need to account for structural changes and trends over time, ensuring a more accurate analysis of the dynamic interactions between these economic indicators.
Trend Analysis (Kernel density)
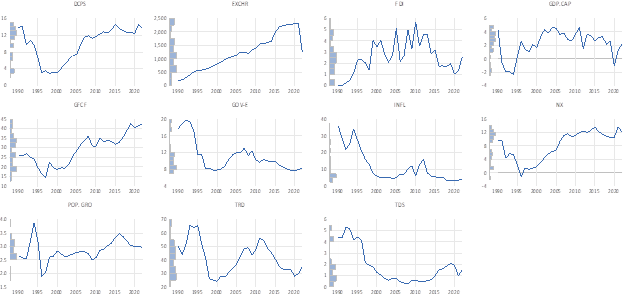
Table 3 presents the results of the lag order selection criteria used to determine the optimal lag length for the model. The criteria include the log-likelihood (LogL), likelihood ratio (LR), final prediction error (FPE), Akaike Information Criterion (AIC), Schwarz Criterion (SC), and Hannan-Quinn Criterion (HQ). LogL represents the log of the likelihood function, which measures how well the model fits the data. Based on the values of the LR, FPE, AIC, SC, and HQ, the results suggest that lag 2 is the optimal lag length for the model. This lag selection minimizes prediction error and maximizes model fit, ensuring the best balance between accuracy and complexity.
Lag Order Selection Criteria
|
Lag |
LogL |
LR |
FPE |
AIC |
SC |
HQ |
|
0 |
-758.11 |
NA |
1.57 |
49.55 |
50.01 |
49.70 |
|
1 |
-499.59 |
333.57 |
78627.12 |
39.32 |
44.41 |
40.98 |
|
2 |
-218.54 |
181.32* |
9.09* |
27.64* |
37.36* |
30.81* |
Table 4 reports the results of the Johansen cointegration test using the Trace statistic. The test is used to determine the presence and number of cointegrating relationships among the variables. Cointegration implies a long-run equilibrium relationship between variables in the model. This result strongly suggests that the variables in the model move together in the long run, providing evidence of multiple cointegrating relationships among the variables of interest.
Johansen Cointegration Test
Unrestricted Cointegration Rank Test (Trace)
|
Hypothesized No. of CE(s) |
Eigenvalue |
Trace Statistic |
0.05 Critical Value |
Prob.** |
|
None * |
0.99 |
721.44 |
239.23 |
0.000 |
|
At most 1 * |
0.97 |
556.28 |
197.37 |
0.000 |
|
At most 2 * |
0.96 |
437.12 |
159.52 |
0.000 |
|
At most 3 * |
0.92 |
330.90 |
125.61 |
0.000 |
|
At most 4 * |
0.90 |
248.86 |
95.75 |
0.000 |
|
At most 5 * |
0.87 |
176.86 |
69.81 |
0.000 |
|
At most 6 * |
0.78 |
111.75 |
47.85 |
0.000 |
|
At most 7 * |
0.71 |
64.40 |
29.79 |
0.000 |
|
At most 8 * |
0.38 |
25.34 |
15.49 |
0.001 |
|
At most 9 * |
0.28 |
10.19 |
3.84 |
0.001 |
Trace test indicates 10 cointegrating eqn(s) at the 0.05 level
* Denotes rejection of the hypothesis at the 0.05 level
**MacKinnon-Haug-Michelis (1999) p-values
In Table 5, cointegration Rank Test (Maximum Eigenvalue) is used to determine the number of cointegrating vectors in the model. This test compares the null hypothesis that there are r cointegrating vectors against the alternative that there are r + 1 vectors. The maximum eigenvalue test focuses on the largest eigenvalue, which measures the strength of each potential cointegrating relationship. Max-Eigen Statistic: This statistic tests the null hypothesis of r cointegrating equations against the alternative of r + 1. It compares the difference between the largest eigenvalue and the subsequent eigenvalue. Eigenvalue: Represents the strength of the relationship among the variables in the corresponding cointegrating equation. Probability (Prob.): Indicates the significance level for rejecting the null hypothesis. A p-value less than .05 suggests rejecting the null hypothesis at the 5% significance level. The Max-Eigenvalue test rejects the null hypothesis at the 5% significance level for all levels of cointegration (from "None" to "At most 9"). The test identifies 10 cointegrating equations based on the maximum eigenvalue statistics, as each null hypothesis is rejected (p-values < .05). These results provide strong evidence for the existence of multiple long-run equilibrium relationships among the variables in the model. The maximum eigenvalue test, together with the trace test results, suggests the presence of 10 cointegrating vectors, indicating a robust long-run relationship between the variables.
In Figure 2, the impulse response graph displays the dynamic relationships between Foreign Direct Investment (FDI) and several key economic variables in Tanzania over a specified time horizon following a shock to FDI. Each subplot represents the response of the different variables such as GDP per Capita (GDP_CAP), government expenditure (GOV_E), inflation (INFL), total debt service (TDS), and trade (TRD) to an impulse in FDI. The initial response of GDP_CAP to a shock in FDI shows a positive correlation, suggesting that increases in FDI stimulate economic growth immediately. This aligns with the notion that foreign investments enhance capital formation and productivity, contributing to GDP growth. As time progresses, the responses of the various variables may fluctuate. For instance, the graph may show that while GDP_CAP initially rises in response to FDI, there might be a subsequent dip or stabilization as the economy adjusts to the new level of investment. This reflects the short-term excitement and longer-term stabilization of economic growth.
Other variables, such as inflation, exhibit an initial increase as FDI inflows boost demand in the economy, leading to upward pressure on prices. Over time, however, as the economy absorbs the investment, inflation may stabilize or decrease, depending on the effectiveness of monetary policy and the capacity of the economy to produce goods and services. The impulse response of variables like trade (TRD) demonstrates a gradual positive impact over time, reflecting how increased FDI can enhance trade capabilities, whether through improved infrastructure or increased production capacity. The relationship between FDI and government expenditure (GOV_E) may also be noteworthy, as initial increases in FDI could lead to greater tax revenues for the government, potentially allowing for increased public spending on infrastructure or social programs. Ultimately, the graph indicates a convergence towards a long-term equilibrium. Variables may display a tendency to stabilize around new levels after the initial shock. The positive response of GDP_CAP alongside a controlled inflationary response can suggest that FDI plays a critical role in fostering sustainable economic growth in Tanzania. These dynamics highlight the importance of creating a favorable investment climate to attract and sustain FDI. Policymakers in Tanzania might focus on improving regulatory frameworks, investing in infrastructure, and ensuring macroeconomic stability to harness the full potential of FDI for long-term economic development.
In conclusion, the impulse response graph serves as a valuable analytical tool, illustrating how FDI impacts various economic indicators over time. It underscores the complex interplay between foreign investment and economic growth, offering insights that can guide policy decisions aimed at maximizing the benefits of FDI in Tanzania.
Impulse and Variables’ Response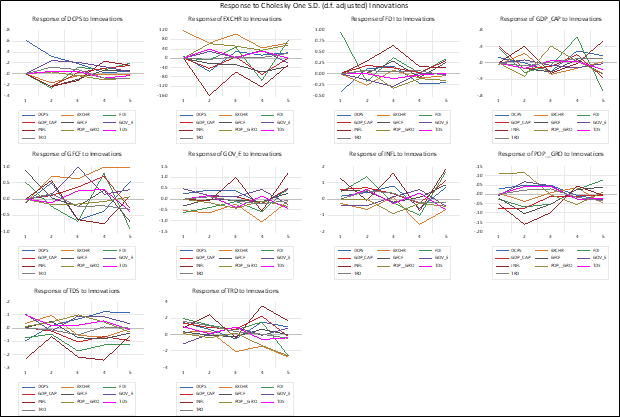
The VECM Stability Analysis
Table 6 presents the eigenvalues and their respective moduli for the companion matrix utilized in the stability analysis of the VECM. This stability analysis is conducted to determine if the VECM model is stable and meets the stability criteria.
In Table 6, the eigenvalues of the companion matrix for a VECM model must have moduli that are less than or equal to 1 for the model to be considered stable. The table shows that all eigenvalues have moduli below 1, which indicates that the VECM model meets the stability condition. Additionally, the VECM specification includes five-unit moduli, meaning there are five eigenvalues with a modulus equal to 1. These unit eigenvalues signify the cointegrating relationships within the VECM model, highlighting the long-run equilibrium among the variables. Overall, the stability analysis confirms that the VECM model is stable and suitable for the data, with well-defined cointegrating relationships. Figure 3 illustrates the Roots of the Companion Matrix, providing important insights into the model's stability. The plot presents the eigenvalues, with the real component plotted on the x-axis and the imaginary component on the y-axis. Notably, the root with a modulus of 0.95 is significant, as it indicates how close the model is to the unit circle. A visual assessment of this relationship further affirms the model's stability, enhancing its reliability and suitability for the data employed in this study.
Roots Characteristics Polynomial
|
ROOT |
Modulus |
|
-1.164998 |
1.164998 |
|
-0.601894-0.875692i |
1.062597 |
|
-0.794001+0.562218i |
1.062597 |
|
-0.794001-0.562218i |
0.972897 |
|
0.921137-0.151093i |
0.972897 |
|
0.921137+0.151093i |
0.933447 |
|
0.036875-0.890857i |
0.933447 |
|
0.036875-0.890857i |
0.891620 |
|
0.825569+0.316773i |
0.891620 |
|
0.825569+0.316773i |
0.884256 |
|
0.478567-0713008i |
0.884256 |
|
0.478567-0713008i |
0.858724 |
|
-0.322183-0.659144i |
0.858724 |
|
-0.322183+0.659144i |
0.733671 |
|
-0.573128-0.300652i |
0.647200 |
|
-0.573128-0.300652i |
0.647200 |
|
-0. 616813 |
0.616813 |
|
0.340638+0.478883i |
0.587676 |
|
0.340638-0.478883i |
0.587676 |
Figure 3 shows Roots of the Companion Matrix, offering valuable insights into the stability of the model under consideration, likely within the context of a Vector Autoregression (VAR) or Vector Error Correction Model (VECM). The eigenvalues are plotted with the real component on the x-axis and the imaginary component on the y-axis. The plot presents a series of points representing the eigenvalues of the companion matrix. The placement of these points in the graph provides an immediate visual assessment of the model’s stability. The significance of the unit circle, which is typically represented in such plots, cannot be overstated. For the model to be stable, all eigenvalues must lie within this unit circle, indicating that the moduli of the eigenvalues are less than one. This means that any shocks to the system will diminish over time, rather than escalate, ensuring that the system returns to equilibrium.
Inverse Roots of AR Characteristic Polynomial
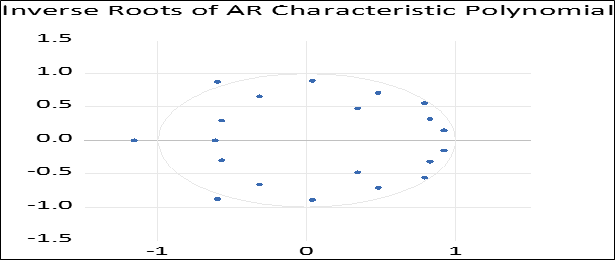
If the plotted points are all contained within the unit circle, it confirms that the VECM or VAR model is stable. Conversely, if any eigenvalue lies outside the unit circle, it suggests potential instability within the model, indicating that shocks could grow over time, leading to unpredictable or divergent behavior in the economic variables being studied. The real part of the eigenvalues (on the x-axis) indicates the tendency of the system to either grow or decay, while the imaginary part (on the y-axis) reflects the oscillatory nature of the system's response. Eigenvalues close to the real axis suggest a slow adjustment process, whereas those with significant imaginary components may indicate oscillations in the response to shocks.
Understanding the stability of the model is crucial for drawing reliable conclusions about the relationships between variables, particularly in economic contexts where policies may be adjusted based on model predictions. A stable model ensures that forecasts and insights derived from the analysis are robust and reliable. The graph depicting the Roots of the Companion Matrix is a critical diagnostic tool for evaluating the stability of econometric models. By analyzing the eigenvalues in relation to the unit circle, researchers can ascertain the dynamic properties of the system, guiding them in making informed decisions based on the model's behavior. Overall, the stability analysis not only enhances the understanding of the relationships between economic variables but also strengthens the validity of the conclusions drawn from the model.
Johansen normalized test
The normality test examines whether the residuals (errors) from the regression model are normally distributed. Residuals should ideally be normally distributed for valid statistical inference in many econometric models. Skewness measures the asymmetry of the residual distribution. A value of 0 indicates a perfectly symmetrical distribution. Most components have skewness close to 0, indicating slight asymmetry. While some individual components (notably component 10) show deviations from normality, the joint test suggests that, overall, the residuals are normally distributed. This result supports the assumption of normality for the residuals in the model, which is crucial for valid statistical inference. Table 7 presents the results of the residual normality test for each component, including skewness, kurtosis, and the Jarque-Bera statistic.
Residual Normality Test
|
Component |
Skewness |
Chi-sq |
df |
Prob |
Kurtosis |
Prob |
Jacque-Bera |
df |
Prob |
|
1 |
-0.52 |
1.41 |
1 |
0.23 |
3.58 |
0.50 |
1.85 |
2 |
0.39 |
|
2 |
-0.30 |
0.47 |
1 |
0.49 |
2.79 |
0.81 |
0.52 |
2 |
0.77 |
|
3 |
-0.38 |
0.74 |
1 |
0.38 |
2.70 |
0.73 |
0.86 |
2 |
0.65 |
|
4 |
-0.58 |
1.73 |
1 |
0.18 |
4.73 |
0.04 |
5.64 |
2 |
0.05 |
|
5 |
-0.04 |
0.00 |
1 |
0.92 |
4.59 |
0.07 |
3.27 |
2 |
0.19 |
|
6 |
-0.47 |
1.88 |
1 |
0.27 |
2.52 |
0. 58 |
1.48 |
2 |
0.47 |
|
7 |
0.22 |
0.25 |
1 |
0.61 |
3.11 |
0.89 |
0.27 |
2 |
0.87 |
|
8 |
-0.73 |
2.77 |
1 |
0.09 |
3.75 |
0.38 |
3.51 |
2 |
0.17 |
|
9 |
0.28 |
0.40 |
1 |
0.52 |
3.07 |
0.92 |
0.41 |
2 |
0.81 |
|
10 |
0.95 |
4.69 |
1 |
0.03 |
5.05 |
0.01 |
10.15 |
2 |
0.00 |
|
Joint |
|
13.70 |
10 |
0.18 |
|
|
28.01 |
|
0.10 |
Discussion
The findings of this study reveal a significant and positive impact of foreign direct investment (FDI) on economic growth in Tanzania, both in its current and lagged forms. This underscores the critical role that FDI plays in stimulating sustained economic development, particularly in a developing economy where access to capital and advanced technologies may be limited (Mwakabungu & Kauangal, 2023). The results suggest that policymakers should prioritize the formulation of strategies aimed at attracting and retaining foreign investment, including offering incentives for multinational corporations and enhancing the overall business environment. The influence of trade (TRD) on economic growth corroborates existing literature, reinforcing the notion that trade openness fosters investment and economic performance (Magai, 2022). The positive correlation indicates that as Tanzania increases its trade activities, particularly with foreign partners, it can enhance its attractiveness for FDI, thereby stimulating economic growth. Therefore, initiatives to bolster trade, such as reducing tariffs and improving trade agreements, should be integral to Tanzania's economic policy framework.
Government expenditure (GOV_E) was also found to have a significant impact on economic growth, which is consistent with the literature emphasizing that government investments in infrastructure and social services are essential for fostering a conducive environment for economic activity (Taylor, 2020). This highlights the importance of maintaining robust public investment to support economic growth and improve the overall investment climate, which in turn can attract more FDI. Population growth (POP_GRO) presents an interesting dynamic within this context. While a growing population can signal potential market expansion and labor availability, the results indicate that merely increasing population numbers is insufficient for driving economic growth without concurrent investments in education and infrastructure (Utouh et al., 2024). Policymakers should consider strategies that leverage population growth through improved education and training, ensuring that the workforce is equipped with the necessary skills to meet the demands of a changing economy.
The study's results also highlight the importance of managing total debt services (TDS) effectively. High levels of debt can strain government resources, leading to reduced public investment and potentially deterring FDI (Lelya & Ngaruko, 2021). Therefore, maintaining a sustainable debt level is crucial for ensuring that the government can continue to invest in key areas that promote economic growth. Additionally, the findings indicate that inflation (INFL) negatively affects economic growth, particularly when considering its lagged effects. This aligns with previous studies that suggest past inflationary pressures may hinder current economic performance (Maiga, 2024). Therefore, policymakers must prioritize inflation control measures to foster a stable economic environment conducive to growth. Moreover, gross fixed capital formation (GFCF) has shown a positive relationship with economic growth, reaffirming the widely recognized need for substantial investment in physical assets, including infrastructure and technology, to support sustained growth (Epaphra & Mwakalasya, 2017). Policymakers should focus on enhancing the investment climate to encourage higher levels of gross fixed capital formation. While FDI represents a significant opportunity for economic growth in Tanzania, achieving its full potential necessitates a multifaceted approach by policymakers. This includes creating a stable macroeconomic environment, enhancing trade conditions, ensuring effective government expenditure, managing population growth through education, maintaining sustainable debt levels, controlling inflation, and promoting gross fixed capital formation. By addressing these critical factors, Tanzania can enhance its ability to attract and benefit from foreign direct investment, ultimately driving sustainable economic growth.
Conclusion
This study has provided valuable insights into the intricate relationship between Foreign Direct Investment (FDI) and economic growth in Tanzania. The results confirm that FDI plays a significant role in driving economic growth, highlighting its potential to enhance productivity, create jobs, and facilitate technology transfer in a developing economy. By employing time series analysis and robust econometric models, this research has demonstrated the positive impacts of trade, government expenditure, and gross fixed capital formation on economic growth while also addressing the complexities introduced by inflation and debt services. The findings emphasize the importance of creating a favorable investment climate that attracts FDI. Policymakers are encouraged to prioritize strategies that include enhancing trade conditions, managing public spending effectively, and controlling inflation to ensure a stable macroeconomic environment. Additionally, it is crucial to leverage population growth by investing in education and infrastructure, ensuring that the workforce is prepared to meet the demands of a rapidly changing economy. Ultimately, for Tanzania to fully realize the benefits of FDI and drive sustainable economic growth, a coordinated approach is needed. This involves not only attracting foreign investment but also ensuring that the necessary institutional frameworks and policies are in place to support long-term development. By implementing these strategies, Tanzania can position itself as a competitive player in the global economy, fostering inclusive growth that benefits all segments of society.
References
Ai-Jun, G., Mohsin, A. K. M., Ahmed, S. F., Shumshunnahar, M., Rahman, A., Amer, E. A. A. A., & Tushar, H. (2024). Exploring the nexus between FDI inflows and economic growth: A sectoral level analysis. PLoS ONE, 19(5 May), 13–17. https://doi.org/10.1371/journal.pone.0301220
Al-Mutairi, A., Naser, D., Naser, H., & Naser, K. (2024). The Effect of Foreign Direct Investment (FDI), remittances, inflation, education, trade and unemployment on the Palestinian economic growth. Montenegrin Journal of Economics, 20(3), 177–190. https://doi.org/10.14254/1800-5845/2024.20-3.13
Al-Smadi, R. W., & Al-Smadi, A. W. (2024). The relationship between foreign direct investment and financial inclusion in MENA countries: Evidence from the General Method of Moments. Investment Management and Financial Innovations, 21(2), 144–154. https://doi.org/10.21511/imfi.21(2).2024.11
Alhassan, T. F., Ansah, E. O., Niyazbekova, S. U., & Blokhina, T. K. (2024). The impact of foreign investment in financing sustainable development in Sub-Saharan African countries. Russian Journal of Economics, 10(1), 60–83. https://doi.org/10.32609/j.ruje.10.105745
Bieleń, M., Ikani, K. S., & Włodarczyk, J. (2024). Diversity within commonality: A comparative study of the impact of foreign direct investment and trade openness on economic growth. Journal of International Studies, 17(1), 174–187. https://doi.org/10.14254/2071-8330.2024/17-1/10
Boay, M. P., Mgale, Y. J., & Mkelenga, A. (2023). Analysis of the short and long-run effects of macroeconomic variables on foreign direct investment inflows to Tanzania. Journal of Economics and Sustainable Development, February 2023, 7–15. https://doi.org/10.7176/jesd/14-2-02
Byaro, M., Mgale, Y., & Mafwolo, & G. (2022). Economic Growth benefits more from population health than foreign direct investment: Evidence from Tanzania. African Journal of Economic Review, 10(3), 110–129.
Dahal, A. K., Bhattarai, G., & Budhathoki, P. B. (2024). Impact of foreign trade and foreign direct investment on economic growth: Empirical insights from Nepal. Problems and Perspectives in Management, 22(1), 390–400. https://doi.org/10.21511/ppm.22(1).2024.32
Eloho, O. O. E., Emmanuel, A. O., Dabor, A. O., & Dabor, E. L. (2024). Tax revenue, capital market performance and foreign direct investment in an emerging economy. International Journal of Economics and Financial Issues, 14(4), 290–298. https://doi.org/10.32479/ijefi.16043
Epaphra, M. (2016). Foreign direct investment and sectoral performance in Tanzania. Journal of Economics and Political Economy, 3(4), 670–719. www.kspjournals.org
Epaphra, M., & Mwakalasya, A. H. (2017). Analysis of foreign direct investment, agricultural sector and economic growth in Tanzania. Modern Economy, 08(01), 111–140. https://doi.org/10.4236/me.2017.81008
Epor, S. O., Yua, H., & Terhemba Iorember, P. (2024). Foreign direct investment and economic growth in developing countries: The role of international trade and foreign debt. Modern Finance, 2(1), 1–17. https://doi.org/10.61351/mf.v2i1.87
Fazaalloh, A. M. (2024). FDI and economic growth in Indonesia: a provincial and sectoral analysis. Journal of Economic Structures, 13(1). https://doi.org/10.1186/s40008-023-00323-w
Gibogwe, V., Nigo, A., & Kufuor, K. (2022). Empirical research on foreign direct investment and economic growth in Tanzania. Journal of Research, Innovation and Technologies (JoRIT), 1(1), 23. https://doi.org/10.57017/jorit.v1.1(1).02
Hasan, R., & Barua, S. (2015). Financial development and economic growth: Evidence from a panel study on South Asian countries. Asian Economic and Financial Review, 5(10), 1159-1173.
He, Y. (2024). E-commerce and foreign direct investment: pioneering a new era of trade strategies. Humanities and Social Sciences Communications, 11(1). https://doi.org/10.1057/s41599-024-03062-w
Husnain, M. A., Guo, P., Pan, G., & Manjang, M. (2024). Unveiling the interplay of institutional quality, foreign direct investment, inflation and domestic investment on economic growth: Empirical evidence for Latin America. International Journal of Economics and Financial Issues, 14(1), 85–94. https://doi.org/10.32479/ijefi.15580
Kitole, F. A., & Utouh, H. M. L. (2023). Foreign direct investment and industrialization in Tanzania admixture time series forecast analysis 1960 - 2020. Applied Economics Letters, 00(00), 1–8. https://doi.org/10.1080/13504851.2023.2211324
Larbi, D., & Nawal, C. (2023). The impact of trade openness on FDI inflows amid structural economic vulnerability in three least developed countries (Djibouti , Haiti and Tanzania) during the period 2004 -2018 using panel ARDL model. Journal of Economic Growth and Entrepreneurship JEGE, 6(2), 9–15.
Lelya, L. L., & Ngaruko, D. D. (2021). Impact of national debt on economic growth in Tanzania: 1980-2019. Asian Journal of Economics, Business and Accounting, 21(3), 85–96. https://doi.org/10.9734/ajeba/2021/v21i330363
Magai, P. (2022). Trade and foreign direct investment in Tanzania: Do they matter for economic growth? Tanzanian Economic Review, 11(2), 22–40. https://doi.org/10.56279/ter.v11i2.82
Magai, P. S. (2018). An econometric analysis of trade and economic growth in Tanzania : Evidence from time series data. Business Management Review, 21(June), 74–84.
Maiga, Y. (2024). Impact of inflation on economic growth: Evidence from Tanzania. Journal of Agricultural Studies, 12(2), 77. https://doi.org/10.5296/jas.v12i2.21708
Makhoba, B. P. (2024). Empirical analysis of foreign direct investment and export performance in South Africa. African Journal of Business & Economic Research, 19(1).https://hdl.handle.net/10520/ejc-aa_ajber_v19_n1_a9
Malik, A., & Sah, A. N. (2024). Does FDI impact the economic growth of BRICS economies? Evidence from Bayesian VAR. Journal of Risk and Financial Management, 17(1). https://doi.org/10.3390/jrfm17010010
Mano, H. (2024). Foreign direct investment and domestic private investment in WAEMU countries: Crowding-in or crowding-out? International Journal of Economics and Financial Issues, 14(3), 57–65. https://doi.org/10.32479/ijefi.15759
Masanja, C. R. (2018). The extent to which Foreign Direct Investment (FDI) contribute to the growth of host economies: Evidence from Tanzania. Business Management Review, 21(1), 1–22. http://www.journals.udsm.ac.tz/index.php/bmr/article/view/1321
Mawutor, J. K. M., Sogah, E., Christian, F. G., Aboagye, D., Preko, A., Mensah, B. D., & Boateng, O. N. (2023). Foreign direct investment, remittances, real exchange rate, imports, and economic growth in Ghana: An ARDL approach. Cogent Economics and Finance, 11(1), 1–28. https://doi.org/10.1080/23322039.2023.2185343
Mba, P. N., & Chijioke, M. I. (2024). Does remittance inflow and foreign direct investment spur economic development in developing countries? Insights from Nigeria. Theoretical and Practical Research in the Economic Fields, 15(1), 127–135. https://doi.org/10.14505/tpref.v15.1(29).12
Mkonyi, G. N., Macheru, J., & Ayako, A. (2022). Socio-economic determinants of fdi flow into the mining sector in Tanzania. International Journal of Economics, 7(2), 1–31.
Mwakabungu, B. H. P., & Kauangal, J. (2023). An empirical analysis of the relationship between FDI and economic growth in Tanzania. Cogent Economics and Finance, 11(1), 1–18. https://doi.org/10.1080/23322039.2023.2204606
Mwanga, E. P. (2022). The impact of foreign direct investment on human development in Tanzania. In University of Johanenesburg (Vol. 5, Issue 1). https://ejournal.poltektegal.ac.id/index.php/siklus/article/view/298%0Ahttp://repositorio.unan.edu.ni/2986/1/5624.pdf%0Ahttp://dx.doi.org/10.1016/j.jana.2015.10.005%0Ahttp://www.biomedcentral.com/1471-2458/12/58%0Ahttp://ovidsp.ovid.com/ovidweb.cgi?T=JS&P
Nawaz, F., Sadiq, M., Oudat, M. S., Saleem, K. A., Kayani, U., & Khan, M. (2024). The relationship between inward foreign direct investment, economic growth and carbon emissions: A Case of Italy from G7 countries. International Journal of Energy Economics and Policy, 14(5), 19–25. https://doi.org/10.32479/ijeep.16329
Odass, B. (2023). Performance of domestic investment in Tanzania : an empirical analysis over the 1980 – 2020 period. Journal of International Economics and Management.
Omran, E. A. M., & Bilan, Y. (2024). Foreign direct investment and unemployment in Egypt. Montenegrin Journal of Economics, 20(1), 171–179. https://doi.org/10.14254/1800-5845/2024.20-1.16
Preepremmote, P. (2024). Impacts of foreign direct investment on economic development: The case of Thailand. Montenegrin Journal of Economics, 20(2), 19–26. https://doi.org/10.14254/1800-5845/2024.20-2.2
Sarker, B. (2024). FDI-growth and trade-growth relationships during crises: evidence from Bangladesh. Financial Innovation, 10(1). https://doi.org/10.1186/s40854-023-00571-6
Shadab, S., & Alam, F. (2024). High-technology exports , foreign direct investment , renewable energy consumption and economic growth : Evidence from the United Arab Emirates.International Journal of Energy Economics and Policy, 14(2), 394–401. https://doi.org/10.32479/ijeep.15188 ABSTRACT Sharmiladevi, J. C. (2024). Impact study of foreign direct investment on carbon dioxide emission, economic growth, trade openness for India following ARDL approach. International Journal of Energy Economics and Policy, 14(1), 612–619. https://doi.org/10.32479/ijeep.15309
Taylor, R. S. (2020). Foreign direct investment and economic growth. Analysis of sectoral foreign direct investment in Tanzania. African Development Review, 32(4), 699–717. https://doi.org/10.1111/1467-8268.12472
Telatar, O. M., & Adimli, T. (2024). Impact of foreign direct investment on renewable energy consumption: Findings from bootstrap ARDL with a fourier function. International Journal of Energy Economics and Policy, 14(5), 301–310. https://doi.org/10.32479/ijeep.16901
Thaddeus, K. J., Ngong, C. A., Nebong, N. M., Akume, A. D., Eleazar, J. U., & Onwumere, J. U. J. (2024). Selected macroeconomic determinants and economic growth in Cameroon (1970–2018) “dead or alive” an ARDL approach. Journal of Business and Socio-Economic Development, 4(1), 1–19. https://doi.org/10.1108/jbsed-05-2021-0061
Tsaurai, K. (2024). Impact of intellectual property rights on foreign direct investment in Africa. Investment Management and Financial Innovations, 21(2), 265–275. https://doi.org/10.21511/imfi.21(2).2024.21
Utouh, H. M. L., Mchukwa, E. W., & Tibuhinda, R. N. (2024). The effects of foreign direct investment on economic growth (Gross Domestic Product) in Tanzania. Economic Insights – Trends and Challenges, 2024(2), 89–100. https://doi.org/10.51865/eitc.2024.02.07
Van Tran, H., Tran, A. V., Hoang, N. B., & Mai, T. N. H. (2024). Asymmetric effects of foreign direct investment and globalization on ecological footprint in Indonesia. PLoS ONE, 19(1 January), 1–23. https://doi.org/10.1371/journal.pone.0297046
World Bank. (2022). World Bank national accounts data, [Online]. https://data.worldbank.org/indicator/
Zhao, M., Chen, Q., Dai, D., Fan, Y., & Xie, J. (2024). The spillover effect of foreign direct investment on China’s high-tech industry based on interprovincial panel data. Sustainability (Switzerland), 16(4). https://doi.org/10.3390/su16041660
Page 1 of
Download Count : 40
Visit Count : 332
Keywords
Economic Growth; Foreign Direct Investment Inflows; Tanzania
Author(s) Information

How to cite this article
Mohamedy Mushi, H., & Ahmed, M. (2025). Analyzing the drivers of foreign direct investment inflows and their impact on economic growth in Tanzania. New Challenges in Accounting and Finance, 13, 1-27. https://doi.org/10.32038/NCAF.2025.13.01
Acknowledgments
Not applicable.
Funding
Not applicable.
Conflict of Interests
No, there are no conflicting interests.
Open Access
This article is licensed under a Creative Commons Attribution 4.0 International License, which permits use, sharing, adaptation, distribution and reproduction in any medium or format, as long as you give appropriate credit to the original author(s) and the source, provide a link to the Creative Commons license, and indicate if changes were made. You may view a copy of Creative Commons Attribution 4.0 International License here: http://creativecommons.org/licenses/by/4.0/