


Original Research
Financial Reporting Quality, CEO Age, and Investment Efficiency: Evidence from the U.S. Market
- Abstract
- Full text
- Metrics
Financial Reporting Quality (FRQ) is crucial for the accurate representation of a company’s financial performance and position. Corporate documentation, such as annual reports, is used by managers to enhance their investment decisions. Better reporting could improve the investment decisions of managers, thus improving the Investment Efficiency (IE) of the company, avoiding both overinvestment and underinvestment. This study examines the impact of financial reporting quality on the firms' investment efficiency using accounting and stock data for U.S. listed firms from 2010 to 2022. The data were acquired through CRSP, Compustat and BoardEx databases. Our final sample consists of 10,350 firms yielding 70,939 firm-to-year observations. We adopted the Chen et al. (2011) approach defining FRQ and Biddle et al. (2009) for IE. Our results show that financial reporting quality is positively related to investment efficiency and that this positive effect is more pronounced in firms with aged CEOs. The study conducts robustness checks on these results by utilizing alternative empirical models. The results lend support to the theory by Biddle et al. (2009), suggesting that firms with high reporting quality are less likely to overinvest or underinvest. Moreover, this study extends the research by demonstrating that CEO age has an enhancing effect on the impact of financial reporting quality (FRQ) on investment efficiency (IE).
Financial Reporting Quality, CEO Age, and Investment Efficiency: Evidence from the U.S. Market
Zhewen Li, Konstantinos A. Athanasiadis*, Michail Fygkioris, Dimitrios N. Koufopoulos
Abstract:
Financial Reporting Quality (FRQ) is crucial for the accurate representation of a company’s financial performance and position. Corporate documentation, such as annual reports, is used by managers to enhance their investment decisions. Better reporting could improve the investment decisions of managers, thus improving the Investment Efficiency (IE) of the company, avoiding both overinvestment and underinvestment. This study examines the impact of financial reporting quality on the firms' investment efficiency using accounting and stock data for U.S. listed firms from 2010 to 2022. The data were acquired through CRSP, Compustat and BoardEx databases. Our final sample consists of 10,350 firms yielding 70,939 firm-to-year observations. We adopted the Chen et al. (2011) approach defining FRQ and Biddle et al. (2009) for IE. Our results show that financial reporting quality is positively related to investment efficiency and that this positive effect is more pronounced in firms with aged CEOs. The study conducts robustness checks on these results by utilizing alternative empirical models. The results lend support to the theory by Biddle et al. (2009), suggesting that firms with high reporting quality are less likely to overinvest or underinvest. Moreover, this study extends the research by demonstrating that CEO age has an enhancing effect on the impact of financial reporting quality (FRQ) on investment efficiency (IE).
Keywords: Financial Reporting Quality, CEO Age, Investment Efficiency
Financial Reporting Quality (FRQ) is a critical aspect of corporate governance that provides transparency for the business world. Accurate and reliable financial statements are essential for stakeholders such as investors, creditors, and regulators to make well-informed decisions about a firm's financial health and potential for growth (Demetriades & Owusu-Agyei, 2022; Rizani & Respati, 2018). High-quality financial reporting fosters investor confidence and facilitates efficient resource allocation in the market (Salehi et al., 2023). In recent years, a series of accounting scandals (i.e., Toshiba) and corporate collapses have highlighted the importance of FRQ and intensified the need for rigorous research on the topic (Demetriades & Owusu-Agyei, 2022).
Investment efficiency is a key determinant of a firm's long-term success and value creation (Assad et al., 2023). It refers to the firm's ability to optimally allocate its resources among various investment opportunities, maximizing shareholder wealth and minimizing the risk of capital misallocation (Biddle et al., 2009; Roychowdhury et al., 2019). In an ideal world, companies would invest only in projects that produce positive net present values (NPVs) (Modigliani & Miller, 1958). Nevertheless, investment decisions made by managers serving their personal interests can diverge significantly from the interests of the shareholders (Assad et al., 2023). External capital providers requiring higher returns and lacking in-depth knowledge of the firm could create financial constraints for the focal firm that would lead to underinvestment (Myers & Majluf, 1984). Underinvestment can also be forced by debt issues, especially for companies with higher levels of leverage (Myers, 1977). In addition, when shareholders decide to renegotiate debt in times when the company experiences financial hardships, the Myers’ underinvestment issue is enlarged (Pawlina, 2010). On the other hand, companies that have free cash flow are more predisposed to agency problems and inclined towards overinvestment (Blanchard et al., 1994; Ding et al., 2019; Jensen, 1986; Opler et al., 1999). Inefficient investments can result in suboptimal capital allocation, reducing firm value and potential financial distress. Investment efficiency is influenced by several factors, including corporate social responsibility, government intervention, the availability of accurate financial information and state and foreign ownership. Understanding the drivers of investment efficiency has become increasingly important for academics, practitioners, and policymakers alike, as it can help identify the factors contributing to a firm's sustainable growth and guide strategies for improving resource allocation.
Investment Efficiency (IE) could be improved by better financial reporting quality as it can mitigate overinvestment and underinvestment by improving management’s investment decisions (Chen et al., 2011). Although many academic studies examine the relationship between FRQ and IE, the results remain mixed, calling for further investigation. We study how the financial reporting quality (FRQ) of public firms in the largest market in the world, the United States, affects IE and how this effect varies with CEO characteristics. Building upon the study of Biddle et al. (2009), this study uses data from 2010 to 2022.
Additionally, our study explores the moderating effect of CEO age on the FRQ-IE relationship, an aspect not previously considered in the literature. By investigating how CEO age influences the association between FRQ and IE, this research provides novel insights into how leadership demographics can shape investment decision-making and the role of financial information therein.
Literature Review
Financial Reporting Quality (FRQ)
FRQ is a fundamental aspect of corporate finance and accounting that captures the accuracy, reliability, and usefulness of financial statements. High-quality financial reporting is characterized by its ability to provide a true and fair view of a company's financial position and performance, thereby aiding stakeholders in making informed decisions. Its significance arises not only from compliance with accounting standards but also from its potential to enhance transparency, reduce information asymmetry, and improve overall trust between a company and its investors, creditors, and other stakeholders.
Jozam and Shafii (2015) explored the interplay between financial reporting quality and investment choices amid the constraints of dividend policy. The study utilizes data from entities registered on the Tehran Stock Exchange from 2006 to 2012, employing a multivariable regression model to analyze the effects of financial reporting quality on dividend policy constraints and investment decisions. Their results underscore the role of financial reporting quality in steering both cash management and the investment actions of companies listed on the exchange. Furthermore, the study points out the pivotal importance of superior financial reporting in influencing research and development investment, especially for companies with abundant growth prospects and those curbing their dividend distributions. The research delves into the non-associated theory stemming from Modigliani and Miller (1958) take on dividend policy, shedding light on the interplay of financial reporting quality with two key determinants - dividend strategies and investment decisions. In essence, the study conveys that robust financial reporting can adeptly mitigate challenges posed by dividend policies on investment considerations. Such revelations are instrumental for companies aspiring to refine their investment blueprints and elevate financial disclosure transparency to magnetize investment prospects.
Similarly, Koo et al. (2017) investigated the influence of the quality of financial reporting on a firm's dividend policy and discovered a statistically significant and economically meaningful positive correlation between financial reporting quality and dividends. It was found that financial reporting quality can induce managers to pay more dividends by constraining free cash flow shortage issues and reducing the occurrence of dividend underpayment. The findings of the research further highlight a significant governance mechanism in which financial reporting elevates dividends by curbing agency issues (Koo et al., 2017).
Lin et al. (2014) investigated the influence of high-quality financial reporting on equity market liquidity during the years from 2008 to 2009 when the global financial crisis swept through the United Kingdom. Notably, the study has a broader perspective that incorporates both financial and non-financial firms, providing a holistic view of corporate financial reporting quality. The key findings reveal that market liquidity decreased substantially during the crisis. However, companies with better financial reporting quality experienced fewer negative impacts from the crisis. The study argues that superior financial reporting reduces information asymmetry, boosting investor confidence in the context of a financial downturn. The paper's strength lies in its robustness checks, as it controls for other influences such as return volatility, loss-making, market value of equity, and potential endogeneity issues. Additionally, the implications remain consistent even when alternative models for earnings quality are adopted. This supports the study's premise that reliable financial reporting can mitigate information uncertainty and restore investor confidence during a crisis.
The research underscores the importance of a stable financial reporting system as part of the broader economic fabric and its role in developing effective financial crisis risk management strategies. Despite the robust findings, potential confounding factors and the accounting role controversy suggest areas for further exploration. Therefore, this study will select data from U.S.-listed companies from 2010 to 2022 to avoid the impact of the financial crisis.
Prior studies provide evidence that FRQ is an important determinant for a variety of firm-level characteristics influencing investment efficiency. Exploring the effect of Financial Reporting Quality (FRQ) on investment efficiency appears to be a promising avenue.
Investment Efficiency (IE)
Investment efficiency is a critical measure of a firm's ability to allocate resources optimally. Understanding the factors influencing investment efficiency is key for stakeholders in evaluating a firm's performance and strategy. Past research has delved into numerous fundamental financial factors and their influence on investment efficiency. These studies have been instrumental in unraveling the intricate interplay between various economic indicators and their impact on the allocation of capital resources.
For companies that are considered to have poor growth prospects, leverage becomes a more stringent constraint, hampering their investment activities. Such firms encounter more substantial hurdles when attempting to recapitalize due to their perceived weaker growth potential. To ensure the credibility of their findings, the study employed various empirical models to evaluate the consistency of the results. Furthermore, the researchers utilized an instrumental variable approach to address endogeneity. Such rigorous methodologies fortified the study's conclusions. Overall, the results support the agency theories related to corporate leverage, particularly emphasizing the constraining effect of leverage on the investments of firms with limited growth potential (Aivazian et al., 2005).
Another investigation delves into how cash holdings influence investment efficiency when moderated by managerial overconfidence within Iranian firms (Asadia et al., 2021). Their study analyzed financial data from 91 non-financial firms listed on the Tehran Stock Exchange between 2010 and 2018. The study used multivariate regression to analyze the interaction between these factors. The results highlight a notable positive correlation between managerial overconfidence and cash holdings, hinting that firms led by overconfident managers might prefer to meet their financial requirements by maintaining excess cash holdings.
Furthermore, Asadia et al. (2021) also found a notable negative correlation between cash holding and investment efficiency. This indicates that when managers have more free cash, there is a potential rise in agency costs. This can lead managers to excessively invest in projects with negative Net Present Value (NPV), thereby reducing investment efficiency. Interestingly, this trend contrasts the interests of shareholders, as financing the company through capital markets would render managers more responsible for their investment choices, reducing funds available for inefficient actions. More importantly, the research found that managerial overconfidence significantly moderates the relationship between cash holding and investment efficiency. Overconfident managers, as a result of their tendency to overestimate their abilities and the accuracy of available information, tend to overinvest in negative NPV projects, thereby reducing investment efficiency (Asadia et al., 2021).
As this research builds a foundation for understanding the relationship between these company-level factors and investment efficiency and given the pivotal role of information asymmetry in investment decisions, it would be worthwhile to investigate how FRQ could further drive or hinder investment efficiency.
Financial Reporting Quality and Investment Efficiency
The relationship between FRQ and IE is an area of active research, and the quality of financial reporting is closely linked to information asymmetry. Past research indicates that superior financial reporting quality can enhance investment efficiency by diminishing information asymmetries that lead to challenges like moral hazard and adverse selection (Biddle et al., 2009). Biddle et al. (2009) further explore this inquiry by detailing the mechanisms through which financial reporting quality connects to investment efficiency. In particular, they examine the propositions that better financial reporting quality correlates with reductions for either over-investment or under-investment.
In contrast to Biddle et al.’s (2009) study, which focused mainly on large, publicly traded companies in the United States, Chen et al. (2011) investigated the impact of financial reporting quality (FRQ) on private firms within emerging markets, a context in which existing literature implies that FRQ might have limited effectiveness in lessening investment inefficiencies. Utilizing firm-level data from the World Bank uncovered evidence that FRQ positively correlates with investment efficiency within their selected sample of firms. Additionally, they found that the relationship between FRQ and investment efficiency intensifies in conjunction with bank financing, but it inversely corresponds to the motivations to reduce earnings for tax purposes. This signifies the intricate dynamics between FRQ and various financial factors in determining investment efficiency.
Despite the tendency for private firms to exhibit lower FRQ compared to their public counterparts in developed markets, it is pertinent to note that alternative information sources for private firms (and firms in countries with generally lower disclosure levels) are relatively scarce beyond accounting. In such scenarios, the study infers a likely strong correlation between financial accounting and management accounting, implying that the information set utilized for financial accounting predominantly mirrors that employed in managerial decisions. Moreover, when juxtaposed with publicly listed corporations in the U.S. and other developed nations, the firms within their sample were subject to fewer compulsory accounting recognition, measurement, and disclosure obligations. This particularity endows these firms with greater discretion in selecting their FRQ. Consequently, the decisions made concerning FRQ possess substantial potential to enhance investment efficiency, thereby underscoring the importance of understanding FRQ dynamics in these contexts. Based on the discussion above, we form the first hypothesis:
H1: Financial Reporting Quality has a positive link with investment efficiency.
CEO Characteristics and Financial Reporting Quality
The role of Top Management Team (TMT) is critical in corporate governance and strategic management. The characteristics of a Top Management Team (TMT) can greatly influence the company's performance, management decisions, and the quality of its financial reporting. Lai and Liu (2017) delve into the potential influence of Top Management Team (TMT) attributes on capital investment efficiency. Analyzing a dataset spanning 2863 firm-year observations between 2003 and 2008 shows clear evidence that TMT characteristics affect investment efficiency.
Earlier studies examined the attributes of corporate leaders that potentially impact the caliber of a company's financial disclosures (Barua et al., 2010; Davidson et al., 2007). One such characteristic that has drawn scholarly interest is the CEO's age. Huang et al. (2012) studied this aspect in depth, examining how the age of a CEO affects the quality of a firm's financial reporting. Their results indicate a positive link between the age of the CEO and the standard of financial reporting. More precisely, they observed a notable negative association between the age of the CEO and the probability of companies achieving or surpassing analyst earnings predictions. This indicates that senior CEOs are less prone to the practice of earnings management to meet or exceed analysts' expectations. Moreover, there was a negative correlation between CEO age and the probability of financial revisions, implying that firms with more seasoned CEOs tend to have fewer financial restatements. Financial restatements often suggest inaccuracies or manipulations in previous financial reports, so a lower likelihood of restatements suggests higher financial reporting quality.
The readability of financial reports and the quality of those reports are closely interlinked. Transparency, accessibility, and comprehensibility are critical aspects of both readability and quality. One of the influential factors impacting financial report readability is the age of executives, an aspect that has been empirically examined in a comprehensive study conducted by Xu et al. (2018) The researchers tested their theory using multiple readability proxies, focusing on the readability of the Management's Discussion and Analysis (MD&A) section and the overall annual report, i.e., the 10-K statement. Their results revealed a positive association between executive age and the clarity of financial reports. People mature as they get older. This growth influences their business insight, enhances their ability to communicate effectively, and sharpens their ethical discernment. Senior CEOs and executives seem better equipped to elucidate operational intricacies and uphold ethical reporting standards, resulting in clearer and more transparent financial statements (Xu et al., 2018).
The above studies offer valuable insights into the connection between CEO age and financial reporting quality, adding to our understanding of how executive characteristics can impact corporate performance and financial transparency. These findings underscore the importance of considering the role of CEO age in the firm's corporate governance and financial reporting practices. These studies, therefore, identified CEO age as a critical determinant of financial reporting quality. According to the above discussions, we form the second hypothesis:
H2: The effect of FRQ on IE is more pronounced in firms with aged CEO.
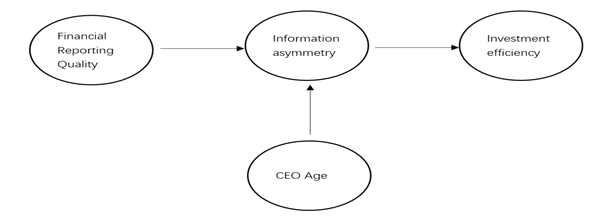
Although previous studies have provided valuable information, as time goes on and the business environment and market demands continue to evolve, new research needs to be conducted to update our understanding and adapt to new circumstances. Figure 1 shows the model used to visually depict the research hypotheses.
Figure 1
Research Model
Method
Data Sources and Sample
The current study focuses on U.S. listed firms spanning from 2010 to 2022. The primary metrics, FRQ and Investment efficiency, are derived from accounting data. To procure this data, we relied on two prominent databases: the CRSP (Center for Research in Security Prices) and Compustat. Additionally, for CEO age, we have sourced data from the BoardEx databases.
Before accounting for missing values, we accumulated a total of 149,399 firm-year observations. After excluding financial and utility firms, 85,561 observations were retained for this period. To reduce the impact of outliers, we winsorized all variables at 1 percent and 99 percent levels. As a result, our final sample consists of 10,350 distinct firms, yielding 70,939 firm-year observations from 2010 to 2022.
Variable Definitions
Table 1 below presents the definitions of the variables used in our study.
Variable Definitions
|
Variables |
Definitions |
|
Independent Variable |
|
|
FRQ |
= the absolute value of residual of the discretionary revenues model as presented in Chen et al. (2011), multiplied by -1. |
|
Dependent Variable |
|
|
IE |
= the absolute value of residual of the firm-specific investment model, as shown in Biddle et al. (2009), multiplied by -1. |
|
Control Variables |
|
|
Firm size |
= the natural logarithm of the book value of total assets. |
|
Leverage |
= the ratio of total debt to book value of total assets. |
|
Variables |
Definitions |
|
Loss |
= an indicator variable referring to whether a firm reports a loss. |
|
Cash |
= the ratio of cash to total assets. |
|
Tangibility |
= the ratio of tangible fixed assets divided by total assets. |
|
Firm age |
= the difference between the firm's initial year in CompStat and the current year. |
|
CEO age |
= the age of the firm in years. |
|
Industry year mean FRQ |
= Industry year mean of FRQ based on Fama- French 49 industry classification |
|
High FRQ |
= companies with financial reporting quality above the industry-year median. |
|
DA |
= the absolute value of residual of the Kothari et al. (2005) discretionary accrual model, multiplied by -1. |
Measures of Investment Efficiency
Biddle et al. (2009) estimate a firm-specific investment model as a function of growth opportunities (measured by sales growth) and use the residuals as a firm-specific proxy for deviations from expected investment. Following the estimated model in Biddle et al.’s (2009) research, we use both capital and non-capital investment to measure IE. 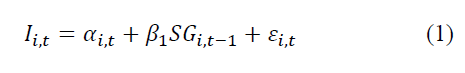
Total investment ( ) is the sum of capital and non-capital expenditure, while sales growth (SG) represents the difference in the company's sales between year t – 2 and t – 1. Eq. (1) is estimated for each industry year based on the Fama and French 49-industry classification for all industries. The predicted value from the regression testing represents the optimal investment level, which is determined based on industry and year factors. Residuals represent the difference between the actual investment of a specific firm and the optimal investment level predicted by the regression model, which is derived based on industry and year factors. When the residual is a positive value, it suggests that the actual investment by the firm exceeds the optimal level predicted by the model, which can be interpreted as ‘overinvestment’. When the residual is a negative value, it indicates that the firm's actual investment is below the optimal level, signifying ‘underinvestment’.
The magnitude of the residuals represents the degree of deviation from investment efficiency, essentially indicating the inefficiency' of the investment. Multiplying the absolute value of the residuals by -1 represents ‘efficiency’; the higher the value, the more efficient the investment.
Measures of Financial Reporting Quality
Following Chen et al.’s (2011) study, I adopt the following measure of FRQ. 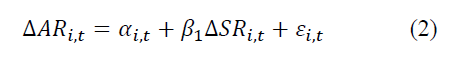
Δ𝐴𝑅𝑖,𝑡 represents the variation in accounts receivable between year t and t – 1, Δ𝑆𝑅𝑖,𝑡 is the annual change in sales revenues and represents residuals. Eq. (2) is estimated for each industry year based on the Fama and French 49-industry classification for all industries. The predicted value from the regression testing represents the optimal financial reporting quality. Discretionary revenues are the residuals from Eq. (2). We multiplied the absolute value of discretionary revenues by -1. Thus, higher values of discretionary revenues represent higher FRQ.
Model of the Study
Following the theories of Biddle et al. (2009) and Chen et al. (2011), we investigate the impact of FRQ on IE using panel data regression models; the baseline model is specified as:


IE represents for the investment efficiency of the firm. In the equation, indicates the error term, and β denotes the coefficient. The subscripts i and t correspond to the firm and fiscal year (where t = 1,2,3, ..., 10), respectively, whereas FRQ refers to the aforementioned measures of financial reporting quality. A variety of control variables are included. Among other explanatory variables, we incorporate the presence of loss ( ). It's assigned a value of "1" if the income before tax and extraordinary items is negative and "0" otherwise. is the standard deviation (SD) of cash flows from operations to sales (t – 2 to t), is the degree of solvency which is measured by Altman Z-score. represents the ratio of operational cash flows to the average total assets. stands for the ratio of tangible fixed assets to total assets. Industry and year fixed effects are also taken into consideration. The independent and control variables lagged one period to address endogeneity problems and capture the lag effects commonly found in financial data.
We include interaction terms between FRQ and CEO age to capture the moderating effect of CEO age. The model is specified as follows: 
IE represents the investment efficiency of the firm, is the error term, β is the coefficient of the equation, subscripts i and t represent firm and fiscal year (where t= 1,2,3, ..., 10), respectively, whereas FRQ is the financial reporting quality measures stated above. CEO represents CEO age measures. Firm Controls represent firm-level control variables and industry, and year-fixed effects are also included.
Findings
Descriptive Statistics
Table 2 presents the summary statistics of major variables used in the regressions, including the number of observations, mean, median, the 25th percentile, 75th percentile, and the standard deviation.
Descriptive Statistics
|
Variables |
N |
M |
Mdn |
Q1 |
Q3 |
SD |
|
|
Investment efficiency |
70939 |
-10.14 |
-5.60 |
-12.85 |
-1.42 |
13.86 |
|
|
FRQ |
70939 |
-2.61 |
-0.12 |
-0.26 |
-0.05 |
20.93 |
|
|
Firm size |
70939 |
6.35 |
6.51 |
4.64 |
8.12 |
2.68 |
|
|
Leverage |
70939 |
0.28 |
0.19 |
0.04 |
0.38 |
0.40 |
|
|
Loss |
70939 |
0.37 |
0 |
0 |
1 |
0.48 |
|
|
Cash |
70939 |
0.19 |
0.10 |
0.03 |
0.26 |
0.22 |
|
|
Tangibility |
70939 |
0.24 |
0.12 |
0.02 |
0.38 |
0.26 |
|
|
Firm age |
70939 |
7.60 |
7.60 |
7.60 |
7.61 |
0.00 |
|
|
CEO age |
21538 |
4.03 |
4.04 |
3.95 |
4.11 |
0.12 |
|
|
Industry year mean FRQ |
70939 |
-2.61 |
-0.17 |
-0.24 |
-0.11 |
19.58 |
|
|
High FRQ |
70939 |
0.49 |
0 |
0 |
1 |
0.50 |
|
|
DA |
|
70939 |
-0.26 |
-0.08 |
-0.26 |
-0.03 |
0.46 |
Note. This table presents the descriptive statistics of major variables used in this study. Table 1 contains the descriptions of all variables reported in this table.
The mean value of investment efficiency is -10.14, which is lower than the median value of -5.60. This difference suggests that the distribution of the variable is likely left-skewed, indicating that there are a substantial number of relatively low values in the dataset that pull the mean value lower than the median.
The interquartile range, defined by Q1 at -12.85, Q2 (the median) at -5.60, and Q3 at -1.42, also supports this indication of skewness. The median is closer to Q3 than Q1, reinforcing the possibility of a left-skewed distribution. The standard deviation is 13.86, which indicates a relatively large spread of data around the mean. This suggests that the data points of investment efficiency are dispersed over a wide range. The left skewness combined with the high standard deviation indicates that the range is predominantly stretched towards the lower or negative side due to the presence of relatively small values or potential outliers.
The average firm financial reporting quality, FRQ, based on account receivable (-2.61) is less than the median (-.12); the data are left-skewed. A few smaller observations drive the average FRQ based on account receivable downwards. The standard deviation of FRQ is 20.932, both of which are very large. This suggests that some companies in the sample have extremely low FRQ based on account receivables.
Chen et al. (2011) investigated the impact of financial reporting quality on private companies in emerging markets, an environment where previous studies suggest that FRQ might not significantly help reduce investment inefficiencies. Their research used firm-level data from the World Bank and found empirical evidence that FRQ improves investment efficiency.
Given that there is not a universally acknowledged metric for FRQ, Chen et al. (2011) utilize three previously researched measures in addition to an aggregate metric for several compelling reasons. Firstly, relying on a single proxy might not encompass all dimensions of FRQ. Secondly, incorporating multiple indicators enhances the generalizability of their findings. Lastly, deploying varied measures reduces the risk that outcomes derived from a single proxy might be influenced by factors other than FRQ, potentially driving the results.
Following Chen et al.’s (2011) theory, we used discretionary accruals as the alternative measure of firm financial reporting quality.
 where represents total accruals; is the change in sales from year t to t–1. is the property plant and equipment. is the change in cash flows from operations from year t to t–1 and represents the error term. The residuals derived from the regression model represent discretionary accruals. In the robustness check, we employ the absolute values of discretionary accruals (DA) as a substitute measure for FRQ. The absolute values of discretionary accruals are multiplied by -1. Thus, higher values of discretionary accruals represent higher FRQ.
The alternative measure of firm financial reporting quality, DA, has a mean value of -.26 and a median value of -.08, with the mean being less than the median. This suggests that the distribution might be left-skewed, indicating a greater density of small values pulling the mean down. This is also supported by the interquartile range (IQR), where Q1 (the 25th percentile) is -.26, Q2 (the median or 50th percentile) is -.08, and Q3 (the 75th percentile) is -0.031. The fact that the median is closer to Q3 than Q1 suggests a left skew as well. Moreover, the standard deviation is .46, which shows a relatively moderate spread of the data points around the mean.
The Effect of Financial Reporting Quality on Investment Efficiency
Table 3 presents the results of the baseline regression models. Two models were used to investigate the effect of Financial Reporting Quality (FRQ) on Investment Efficiency. Both models controlled for industry and year, denoted by the industry and year dummy.
Baseline Regression Models
|
|
(1) |
(2) |
|
|
Investment Efficiency |
Investment Efficiency |
|
|
t |
t |
|
FRQ |
0.00*** |
0.00*** |
|
|
(4.46) |
|
|
Firm size |
|
0.47*** |
|
|
|
(10.67) |
|
Leverage |
|
-2.35*** |
|
|
|
|
|
Cash |
|
-12.25*** |
|
|
|
(-20.31) |
|
Loss |
|
|
|
|
|
(-9.74) |
|
Tangibility |
|
|
|
|
|
|
|
Firm age |
|
169.35*** |
|
|
|
(4.33) |
|
Constant |
-7.86*** |
-1292.90*** |
|
|
(-8.24) |
(-4.35) |
|
Industry dummy |
Y |
Y |
|
Year dummy |
Y |
Y |
|
R2 |
0.23 |
0.29 |
|
Obs. |
70939 |
70939 |
Note. Table 3 showcases the baseline regression models for predicting 'Investment Efficiency'. The models are based on a sample size of 70,939 observations, and the respective R2 values for each model are also reported. Columns (1) and (2) present two different model specifications. Both models adjust for industry and year-fixed effects, as indicated by the presence of industry and year dummies. The significance levels are denoted as *** p < .01, ** p < .05, * p < .1.
In Model 1, where only FRQ was included as an explanatory variable along with the dummies, FRQ was statistically significant at the 1% level (as denoted by ***) with a coefficient of .006. The t-statistic of 4.46, much larger than 1.96 (the critical value at a 5% significance level), confirms the statistical significance of the relationship. This suggests a positive association between FRQ and Investment Efficiency. One percentage point increase in FRQ will increase investment efficiency by .6 percentage point, ceteris paribus.
Model 2 presents the results when investment efficiency regresses on FRQ and other control variables, including Firm Size, Leverage, Cash, Loss, Tangibility, and Firm Age, with industry and year dummy. Despite the addition of these controls, the positive and significant relationship between FRQ and Investment Efficiency persisted, with FRQ's coefficient increasing slightly to 0.008 and its t-statistic rising to 5.35. One percentage point increase in FRQ will increase investment efficiency by .8 percentage point, ceteris paribus.
The controls themselves also exhibited significant relationships with Investment Efficiency. For Firm size, the coefficient of .47 and T-stat. of 10.67, which is positively and statistically significant at the 1% level, indicates that a 1% increase in Firm size, on average, will increase investment efficiency by .47 percentage point, all else being equal. This suggests that larger firms tend to have higher investment efficiency, possibly due to economies of scale, better access to financing, or more effective management. Larger companies possess more flexibility in scheduling their investments and might be more vulnerable to managerial agency issues (Kadapakkam et al., 1998).
Leverage, Cash, Loss, and Tangibility, on the other hand, were negatively related to Investment Efficiency. Leverage is negatively and statistically significant at 1% significance level since the coefficient estimate is -2.351 and T-stat. is -5.80. It shows that leverage is negatively associated with investment efficiency. A 1 percentage point increase in leverage will decrease investment efficiency by 2.35 percentage point, holding all other factors constant. Firms with high levels of leverage are less inclined to pursue valuable growth opportunities than those with minimal leverage because they are more constrained in their investment decisions to achieve optimal investment efficiency (Aivazian et al., 2005).
The coefficient estimate of Cash is negatively and statistically significant at 1% significance level since the coefficient and t-statistics of Cash is -12.252 and -20.312, respectively. This indicates that Cash is negatively associated with investment efficiency. The coefficient of -12.252 indicates that a one percentage point increase in a firm's cash holdings is associated with a 12.252 percentage point decrease in Investment Efficiency, ceteris paribus. This also aligns with the theory proposed by Asadia et al. (2021), stating that an increase in managers' discretionary free cash flow can escalate agency costs. This leads managers to invest more heavily in projects with negative net present values, consequently decreasing investment efficiency.
Loss is negatively and statistically significant at 1% significance level since the coefficient and t-statistics is -1.512 and -9.748. It suggests that loss is negatively associated with investment efficiency. One percentage point increase in loss will decrease investment efficiency by 1.512 percentage point, ceteris paribus. These results are in line with the findings of Shahzad et al. (2018). When a company experiences financial losses, the amount of capital available for investment decreases. This limited capital may cause the company to miss potentially profitable opportunities, thus reducing investment efficiency. Losses can also lead to credit constraints, as lenders may be less willing to extend credit to a loss-making company. This can limit the company's ability to leverage for investment purposes, further decreasing investment efficiency.
The coefficient estimate of Tangibility is negatively and statistically significant at 1% significance level since the coefficient and t-statistics is -6.93 and -14.907. It shows that Tangibility is negatively associated with investment efficiency. On average, a one percentage point increase in Tangibility will decrease investment efficiency by 6.93, ceteris paribus.
Firm Age, like Firm Size, was positively related to Investment Efficiency, with a coefficient of 169.35 and a t-statistic of 4.33. Older firms have more experience, established processes, and relationships that help them invest more efficiently. Firms in their maturity stage exhibited the highest level of investment efficiency, which was subsequently followed by those in their growth stage (Ahmed et al., 2020).
The R-squared values for Models 1 and 2 were .23 and .29, respectively, indicating that the models explained approximately 24% and 29% of the variance in Investment Efficiency. The increase in R-squared from Model 1 to Model 2 suggests that the additional control variables significantly improved the model's explanatory power.
These findings support the H1 that financial reporting quality has a positive link with investment efficiency, and this relationship persists even when controlling for a variety of firm-specific factors. Our findings also align with the theory proposed by Biddle et al. (2009) that firms with higher financial reporting quality are less likely to depart from their anticipated level of investment. High-quality accounting information can help companies overcome the problem of overinvestment and underinvestment, thus increasing investment efficiency in US public companies. Further analysis and discussions will be provided in the following sections of this dissertation.
The Effect of CEO Age on the Relationship between Financial Reporting Quality and Investment Efficiency
In Table 4, the research further examines the moderating effect of CEO age on the relationship between Financial Reporting Quality (FRQ) and Investment Efficiency. An earlier study (Huang et al., 2012) looked into factors such as CEO characteristics, notably CEO age, to examine the determinants of financial reporting quality. Their findings suggested a positive correlation between CEO age and the overall quality of financial reporting. Thus, we incorporated an interaction term of FRQ and CEO age into the model. By examining the significance and the sign of this interaction term, the research aims to explore whether CEO age impacts the enhancement role of FRQ on investment efficiency.
Table 4 shows the results of a regression analysis conducted on a sample of 21,538 companies. The first column (1) shows the regression results without the control variables but including industry and year dummies. The second column (2) includes both the control variables (Firm size, Leverage, Cash, Loss, Tangibility, Firm age) and the dummies.
The Effect of CEO Age on the Relationship between Financial Reporting and Investment Efficiency (H2)
Note. Table 4 examines the effect of 'CEO age' on the link between financial reporting (FRQ) and 'Investment Efficiency' for Hypothesis 2. Both models control for industry and year variations and are based on 21,538 observations. Columns (1) and (2) offer different specifications. The interaction term 'FRQ*CEO age' highlights the moderating effect. T-statistics are shown in parentheses; significance levels are marked with *, **, or ***.
Focusing on the interaction term FRQ*CEO age, the regression outputs suggest an interesting observation. This term is statistically significant in both models, suggesting that CEO age does indeed modify the relationship between FRQ and investment efficiency.
In both models (1) and (2), the CEO age variable shows statistical significance at the 1% level, with t-statistics of 5.10 and 4.48, respectively. Given the positive coefficients of 'CEO age' in both models (4.87 in model 1 and 3.99 in model 2), CEO age has a statistically significant impact on investment efficiency. This finding is consistent with our theoretical expectations, indicating that the firm's investment efficiency significantly improves as the CEO's age increases. Older CEOs, with their sharper business acumen, stronger ability for effective communication, and a higher ethical standard in reporting, are more adept at making effective investment decisions (Huang et al., 2012; Xu et al., 2018).
In Model 1, the FRQ*CEO age interaction term has a positive coefficient of .02, which is statistically significant at the 5% level (t = 1.97). In Model 2, with control variables added, the coefficient is .04 and statistically significant at the 1% level (t = 3.02).
This implies that as the CEO's age increases, the negative relationship between FRQ and Investment Efficiency weakens, meaning that older CEOs tend to make better use of high-quality financial reporting for efficient investment decision-making. Therefore, CEO age appears to be a key factor moderating the relationship between FRQ and investment efficiency, demonstrating the importance of management characteristics in corporate investment decisions.
These findings support the H2 that the effect of FRQ on IE is more pronounced in firms with aged CEOs. The significance of this relationship is further amplified when various firm-specific factors are controlled for. This also aligns with the findings from the research conducted by Xu et al. (2018), suggesting that senior executives, particularly older CEOs, exhibit a heightened ability to articulate complex operational details and maintain ethical standards in financial reporting. Consequently, this attribute contributes to the production of financial reports that are more comprehensible and transparent (Xu et al., 2018), which means reducing information asymmetry and thus improving investment efficiency (Huang et al., 2012).
Robustness Check
Following the approach of Chen et al. (2011), discretionary accruals are used as an alternative measure for financial reporting quality. Residuals obtained from the regression model signify discretionary accruals. By multiplying the absolute values of discretionary accruals by -1, a greater value of discretionary accruals corresponds to a superior FRQ.
Table 5 presents the regression results when investment efficiency regresses on the alternative measure of financial reporting quality, measured as discretionary accruals (DA).
Alternative Measure of Financial Reporting Quality
|
|
(1) |
(2) |
|
|
Investment Efficiency |
Investment Efficiency |
|
|
t |
t |
|
DA |
2.30*** |
1.02*** |
|
|
(7.94) |
(4.27) |
|
Firm size |
|
0.44*** |
|
|
|
(10.28) |
|
Leverage |
|
-2.08*** |
|
|
|
(-5.32) |
|
Cash |
|
-12.25*** |
|
|
|
(-20.41) |
|
Loss |
|
-1.50*** |
|
|
|
(-9.68) |
|
Tangibility |
|
-6.86*** |
|
|
|
(-14.71) |
|
Firm age |
|
151.13*** |
|
|
|
(4.24) |
|
Constant |
-7.50*** |
-1154.11*** |
|
|
(-7.78) |
(-4.26) |
|
Industry dummy |
Y |
Y |
|
Year dummy |
Y |
Y |
|
R2 |
0.24 |
0.29 |
|
Obs. |
70939 |
70939 |
Note. Table 5 explores 'Investment Efficiency' using an alternative measure of financial reporting quality, represented by 'DA'. Both models control for industry and year, using 70,939 observations. Columns (1) and (2) present different specifications. ***, **, * indicate significance at the .01, .05, and .10 levels, respectively.
In both Model 1 and Model 2, DA exhibits a significant positive association with Investment Efficiency. In Model 1, the DA coefficient estimate is 2.30 and significant at the 1% level (t = 7.94). After incorporating various control variables in Model 2 (including Firm size, Leverage, Cash, Loss, Tangibility, and Firm age), the DA coefficient estimate remains significantly positive (1.02) with a t-statistic of 4.27, also significant at the 1% level.
These results provide further evidence supporting the role of FRQ in enhancing investment efficiency. With discretionary accruals as an alternative measure for FRQ, the positive relationship is consistent with our earlier results, suggesting the robustness of our findings. This indicates that the extent to which managers can exercise discretion over accounting information (as captured by discretionary accruals) can significantly impact a firm's investment efficiency.
Regardless of the measure used for FRQ, our results consistently support the argument that high-quality financial reporting can lead to improved investment efficiency, thereby underlining the relevance and importance of financial reporting quality in corporate investment decisions.
We address endogeneity problems by using an instrumental variable approach. The instrumental variable (IV) approach is a method used in econometrics to estimate causal relationships when there might be omitted variable bias, reverse causality, or simultaneity, collectively known as endogeneity problems. This method necessitates an instrumental variable, which exhibits correlation with the independent variable of interest yet shows no correlation with the error term in the model.
The IV approach addresses endogeneity in the following manner: First, it uses the instrumental variable, which is related to the endogenous explanatory variables but unrelated to the errors, capturing the variation in the endogenous independent variable that is not related to the error term. Second, the method involves two stages of regression analysis. In the first stage, the endogenous variable is regressed on the instrument(s). In the second stage, the dependent variable is regressed on the predicted values of the endogenous variables from the first stage. This procedure purges the endogenous variable of its correlation with the error term, thereby allowing for consistent and unbiased estimates of the model parameters.
In this study, the potential endogeneity problem might stem from two possible sources: 1) Omitted variables. This issue arises when there are variables that are excluded from the model but are correlated with both the dependent variable and one or more independent variables. The omission of such relevant variables can lead to the correlation of the omitted variables with the error term, which biases the coefficient estimates, leading to endogeneity. 2) Reverse causality. Another potential source of endogeneity in this context is the possibility of reverse causality, where the direction of cause-and-effect is contrary to what is hypothesized. In this case, it could be that firms that want to improve their Investment Efficiency (IE) may choose to disclose more information, causing IE to affect Financial Reporting Quality (FRQ). In such a scenario, a correlation would emerge between FRQ and the error terms, leading to an endogeneity issue.
Table 6 showcases the results of an instrumental variable approach, specifically a two-stage least squares (2SLS) regression, which has been employed to address potential endogeneity issues in the study. The industry year mean of Financial Reporting Quality (FRQ) is used as the instrumental variable.
Instrumental Variable Approach to Address Endogeneity
|
|
(1) |
(2) |
|
|
FRQ |
Investment Efficiency |
|
|
t |
t |
|
|
0.00*** |
|
|
|
|
(5.97) |
|
Industry year mean FRQ |
1.00*** |
|
|
|
(96.16) |
|
|
Firm size |
0.02* |
0.47*** |
|
|
(1.82) |
(10.67) |
|
Leverage |
-0.13** |
-2.35*** |
|
|
(-2.53) |
(-5.80) |
|
Loss |
0.05 |
-1.51*** |
|
|
(1.11) |
(-9.76) |
|
Cash |
0.10 |
-12.25*** |
|
|
(0.74) |
(-20.32) |
|
Tangibility |
0.98*** |
-6.93*** |
|
|
(6.73) |
(-14.91) |
|
Firm age |
-0.76 |
179.26*** |
|
|
(-0.03) |
(4.53) |
|
Constant |
5.37 |
-1368.30*** |
|
|
(0.03) |
(-4.54) |
|
Industry dummy |
Y |
Y |
|
Year dummy |
Y |
Y |
|
R2 |
0.87 |
0.29 |
|
Obs. |
70939 |
70939 |
Note. Table 6 employs an instrumental variable approach to address potential endogeneity. The first column presents the instrumented 'FRQ', using 'Industry year mean FRQ' as the instrument. Column (2) then examines its impact on 'Investment Efficiency'. *, **, and *** denote significance levels of .10, .05, and .01, respectively. Both models account for industry and year, based on a sample of 70,939 observations.
In the first stage of this 2SLS regression, we regress FRQ on the industry year mean FRQ to generate the predicted value of FRQ. The instrumented FRQ is highly significant (1.000, t = 96.16), implying a strong relationship between the instrument variable and the potentially endogenous variable FRQ. The high R-squared value of .87 indicates that the instrumental variable does a good job in explaining the variance in FRQ.
In the second stage, the predicted value from the first stage is used in place of the original FRQ in the regression of Investment Efficiency on FRQ and other control variables. The coefficient estimate for the instrumented FRQ in Model 2 is positive and statistically significant at the 1% level (.009, t = 5.97). A 1 percentage point increase in FRQ (instrumented) will increase the investment efficiency by .009 percentage point, ceteris paribus.
In terms of the control variables, their estimates remain similar to those found in the baseline regression models, suggesting that the previous results are robust after addressing endogeneity.
To sum up, the 2SLS regression approach provides robust evidence of a positive relationship between FRQ and Investment Efficiency, addressing potential endogeneity issues arising from omitted variables and reverse causality. This underscores the economic significance of FRQ in promoting optimal investment decisions in firms.
Conclusion
Recent times have seen a heightened demand for corporate transparency, driven by a greater societal emphasis on corporate social responsibility and stakeholder interests. This underscores the significance of financial statements as pivotal information sources for external enterprise investors.
Past research primarily explores the influence of Financial Reporting Quality (FRQ) on Investment Efficiency (IE) within U.S. public firms. Notable studies, such as Biddle et al. (2009), emphasize the inverse relationship between financial reporting quality and market information asymmetry and its subsequent positive effect on investment efficiency. Furthermore, subsequent to Biddle et al.’s (2009) study, the role of audit quality on investment efficiency and the influence of FRQ on private firms in emerging markets have also been spotlighted, as evidenced by Chen et al. (2011).
The earlier paper by Biddle et al. (2009) utilized data from 1993 to 2005. Given the dynamic nature of financial markets and corporate structures, it is imperative to utilize contemporary data to capture more recent trends and nuances. The current study addresses this by employing data from 2010 to 2022, aiming to delve deeper into how the FRQ of listed firms in the world's largest market, the United States, interplays with Investment Efficiency (IE) in light of the evolving CEO age.
This study investigated the effect of financial reporting quality on investment efficiency and examined the moderating role of CEO age on the relationship between financial reporting quality and investment efficiency. Two hypotheses were tested, and the regression results were presented in the preceding sections. Our findings show a positive correlation between the quality of financial reporting and investment efficiency, and this relationship is held even when controlling for other firm-specific factors.
High-quality financial reporting provides more accurate, comprehensive, and timely information. This empowers decision-makers in the firm to make more informed and strategic choices about where and when to allocate resources, thus enhancing investment efficiency. Moreover, high-quality financial reports can reduce information asymmetry between different stakeholders, such as management, shareholders, and potential investors. This transparency can further encourage optimal investment decisions, minimizing the likelihood of overinvestment in unprofitable projects or underinvestment in profitable opportunities. Therefore, improved financial reporting quality contributes to increased investment efficiency by facilitating better investment decision-making and promoting optimal resource allocation within firms.
The findings of the second hypothesis showed that the impact of Financial Reporting Quality (FRQ) on Investment Efficiency (IE) is more noticeable in firms led by older CEOs. Accordingly, older CEOs generally have more years of experience and accumulated knowledge in managing business operations and interpreting financial reports. This experience allows them to better leverage high-quality financial information to make strategic and efficient investment decisions, thereby amplifying the relationship between FRQ and IE. In addition, older CEOs may place a higher value on transparency and financial stability as part of their leadership style. As such, they might encourage creating and using high-quality financial reports within their organization. This, in turn, facilitates more efficient capital allocation decisions, strengthening the impact of FRQ on IE. In the Robustness Check section, I employ an alternate metric for financial reporting quality, represented by discretionary accruals. The outcomes are strikingly similar to our previous results. None of the coefficients that were significant changed their signs. These findings reinforce our preliminary conclusion that Financial Reporting Quality (FRQ) positively influences investment efficiency. This impact becomes more prominent after controlling for various firm-specific factors.
Contribution
This paper extends prior studies on the impact of financial reporting quality (FRQ) on Investment Efficiency (IE) by revisiting the relationship between these two variables with a more recent and extensive dataset. Another contribution of this paper is to explore the moderating effect of CEO age on the FRQ-IE relationship, an aspect that has not been considered in the previous literature.
Limitations and Recommendations
This paper still has limitations. After considering the confounding effect, the regression results are inconsistent with the baseline model. The potential confounding effects from other firm-level factors might not have been fully adjusted for in our baseline regression models. Despite the observed positive influence of Financial Reporting Quality on investment efficiency, these unaccounted factors could skew the true effect.
Accordingly, additional research can be conducted to disentangle these influences and accurately assess the genuine impact of Financial Reporting Quality. First, future studies can better address the confounding issue using the propensity score matching method and then examine whether the results align with the hypotheses of this paper. Secondly, it would be worthwhile to explore the moderating effects of other CEO characteristics and corporate governance mechanisms on the influence of FRQ on IE.
Reference
Ahmed, B., Akbar, M., Sabahat, T., Ali, S., Hussain, A., & Akbar, A. (2020). Does firm life cycle impact corporate investment efficiency? Sustainability, 13(1), 197. https://doi.org/10.3390/su13010197
Aivazian, V. A., Ge, Y., & Qiu, J. (2005). The impact of leverage on firm investment: canadian evidence. Journal of Corporate Finance, 11(1-2), 277–291. https://doi.org/10.1016/s0929-1199(03)00062-2
Assad, N., Jaafar, A., & Zervopoulos, P. D. (2023). The interplay of financial reporting quality and investment efficiency: evidence from the USA. Journal of Financial Reporting and Accounting, ahead-of-print (ahead-of-print). https://doi.org/10.1108/JFRA-04-2023-0199
Asadia, A., Oladia, M., & Aghela, M. G. (2021). Evaluation of managerial overconfidence, cash holding, and investment efficiency in companies. Journal of Mathematics, 1–11. https://doi.org/10.1155/2021/1954526
Barua, A., Davidson, L. F., Rama, D. V., & Thiruvad, S. (2010). CFO gender and accruals quality. Accounting Horizons, 24(1), 25–39. https://doi.org/10.2308/acch.2010.24.1.25
Biddle, G. C., Hilary, G., & Verdi, R. S. (2009). How does financial reporting quality relate to investment efficiency? Journal of Accounting and Economics, 48(2-3), 112–131. https://doi.org/10.1016/j.jacceco.2009.09.001
Blanchard, O. J., Lopez-de-Silanes, F., & Shleifer, A. (1994). What do firms do with cash windfalls? Journal of Financial Economics, 36(3), 337–360. https://doi.org/10.1016/0304-405X(94)90009-4
Chen, F., Hope, O. K., Li, Q., & Wang, X. (2011). Financial reporting quality and investment efficiency of private firms in emerging markets. The Accounting Review, 86(4), 1255–1288. https://doi.org/10.2308/accr-10040
Davidson, W. N., Xie, B., Xu, W., & Ning, Y. (2007). The influence of executive age, career horizon and incentives on pre-turnover earnings management. Journal of Management & Governance, 11(1), 45–60. https://doi.org/10.1007/s10997-007-9015-8
Demetriades, P., & Owusu-Agyei, S. (2022). Fraudulent financial reporting: an application of fraud diamond to Toshiba’s accounting scandal. Journal of Financial Crime, 29(2), 729–763. https://doi.org/10.1108/JFC-05-2021-0108
Ding, S., Knight, J., & Zhang, X. (2019). Does China overinvest? Evidence from a panel of Chinese firms. The European Journal of Finance, 25(6), 489–507. https://doi.org/10.1080/1351847X.2016.1211546
Huang, H. W., Rose-Green, E., & Lee, C. C. (2012). CEO age and financial reporting quality. Accounting Horizons, 26(4), 725–740. https://doi.org/10.2308/acch-50268
Jensen, M. C. (1986). Agency costs of free cash flow, corporate finance, and takeovers. The American Economic Review, 76(2), 323–329. http://www.jstor.org.uniessexlib.idm.oclc.org/stable/1818789
Jozam, M., & Shafii, H. (2015). The role of financial reporting quality on the relation between reducing the limitations of dividend and investment decisions. European Online Journal of Natural and Social Sciences, 4(1). www.european-science.com
Kadapakkam, P. R., Kumar, P. C., & Riddick, L. A. (1998). The impact of cash flows and firm size on investment: the international evidence. Journal of Banking and Finance, 22(3), 293–320. https://doi.org/10.1016/s0378-4266(97)00059-9
Koo, D. S., Ramalingegowda, S., & Yu, Y. (2017). The effect of financial reporting quality on corporate dividend policy. Review of Accounting Studies, 22(2), 753–790. https://doi.org/10.1007/s11142-017-9393-3
Kothari, S. P., Leone, A. J., & Wasley, C. E. (2005). Performance matched discretionary accrual measures. Journal of Accounting and Economics, 39(1), 163–197. https://doi.org/10.1016/j.jacceco.2004.11.002
Lai, S. M., & Liu, C. L. (2017). Management characteristics and corporate investment efficiency. Asia-pacific Journal of Accounting & Economics, 25(3-4), 295–312. https://doi.org/10.1080/16081625.2016.1266270
Lin, Z., Jiang, Y., Tang, Q., & He, X. (2014). Does high-quality financial reporting mitigate the negative impact of global financial crises on firm performance? Evidence from the United Kingdom. Australasian Accounting, business and Finance Journal, 8(5), 19–46. http://dx.doi.org/10.14453/aabfj.v8i5.3
Modigliani, F., & Miller, M. H. (1958). The cost of capital, corporation finance and the theory of investment. The American Economic Review, 48(3), 261–297. http://www.jstor.org/stable/1809766
Myers, S. C. (1977). Determinants of corporate borrowing. Journal of Financial Economics, 5(2), 147–175. https://doi.org/10.1016/0304-405X(77)90015-0
Myers, S. C., & Majluf, N. S. (1984). Corporate financing and investment decisions when firms have information that investors do not have. Journal of Financial Economics, 13(2), 187–221. https://doi.org/10.1016/0304-405X(84)90023-0
Opler, T., Pinkowitz, L., Stulz, R., & Williamson, R. (1999). The determinants and implications of corporate cash holdings. Journal of Financial Economics, 52(1), 3–46. https://doi.org/10.1016/S0304-405X(99)00003-3
Pawlina, G. (2010). Underinvestment, capital structure and strategic debt restructuring. Journal of Corporate Finance, 16(5), 679–702. https://doi.org/10.1016/J.JCORPFIN.2010.06.010
Rizani, F., & Respati, N. W. (2018). Factors influencing the presentation of fraudulent financial reporting in Indonesia. Journal of Advanced Research in Law and Economics, 9(1), 254. https://doi.org/10.14505//jarle.v9.1(31).31
Roychowdhury, S., Shroff, N., & Verdi, R. S. (2019). The effects of financial reporting and disclosure on corporate investment: a review. Journal of Accounting & Economics, 68(2-3), 101246. https://doi.org/10.1016/j.jacceco.2019.101246
Salehi, M., Ammar Ajel, R., & Zimon, G. (2023). The relationship between corporate governance and financial reporting transparency. Journal of Financial Reporting and Accounting, 21(5), 1049–1072. https://doi.org/10.1108/JFRA-04-2021-0102/FULL/PDF
Shahzad, F., Rehman, I. U., Nawaz, F., & Nawab, N. (2018). Does family control explain why corporate social responsibility affects investment efficiency? Corporate Social Responsibility and Environmental Management, 25(5), 880–888. https://doi.org/10.1002/csr.1504
Xu, Q., Fernando, G. D., & Tam, K. (2018). Executive age and the readability of financial reports. Advances in Accounting, 43, 70–81. https://doi.org/10.1016/j.adiac.2018.09.004
Page 1 of
Download Count : 44
Visit Count : 2934
Keywords
Investment Efficiency; CEO Age; Financial Reporting Quality
Author(s) Information


How to cite this article
Li, Z., Athanasiadis, K.A., Fygkioris, M.I., Koufopoulos, D.N. (2024). Financial Reporting Quality, CEO Age, and Investment Efficiency: Evidence from the U.S. Market. New Challenges in Accounting and Finance, 11, 29-53. https://doi.org/10.32038/NCAF.2024.11.03
Acknowledgments
Not applicable.
Funding
Not applicable.
Conflict of Interests
No, there are no conflicting interests.
Open Access
This article is licensed under a Creative Commons Attribution 4.0 International License, which permits use, sharing, adaptation, distribution and reproduction in any medium or format, as long as you give appropriate credit to the original author(s) and the source, provide a link to the Creative Commons license, and indicate if changes were made. You may view a copy of Creative Commons Attribution 4.0 International License here: http://creativecommons.org/licenses/by/4.0/